
There’s no nice way to say it: The past three months have been ugly for the markets – and the “buy and hold” investing crowd.
Some of my favorite market-tracking exchange-traded funds (ETFs) tell the grim tale…
The 1/100 Dow Jones Industrial Average ETF (CBOE: DJX) traded at $177.66 on Dec. 1, 2015. As of Feb. 25, 2016, it’s declined more than 6.2% to $166.28…
The SPDR S&P 500 ETF Trust (NYSE Arca: SPY) could be had for $209.44 a share on Dec. 1, but as of Feb. 25, it’s declined more than 7.7% to $193.07…
And the PowerShares QQQ Trust Series 1 ETF (Nasdaq: QQQ), which tracks the Nasdaq 100, has declined nearly 11%. It’s down to $102.26 from $114.48 in the beginning of December.
What’s worse, these declines actually reflect the oversold bounce we experienced in mid-February. We haven’t seen another.
But… for all that, I’m really excited about the month ahead of us. There are some big profits coming our way.
That’s right. I’m bullish in March, because I’ve seen the same pattern I’m about to show you.
But we have to move quickly, because this bull run will be powerful, but very short-lived. So let’s get ready…
Why I Love These ETFs for This Trade
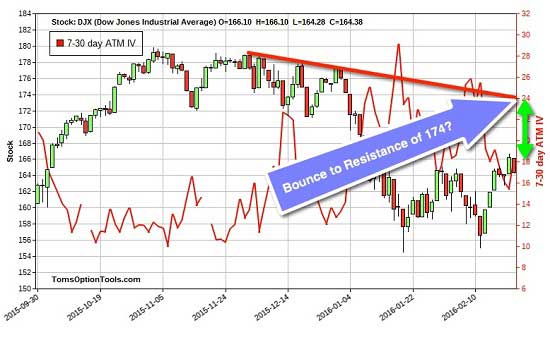
Dow Jones DJX is an ETF that tracks the Dow Jones Industrial Average of 30 of the biggest stocks traded in the United States. Now, the fund trades at 1/100th the value of the index, meaning that if the Dow were at 16,000, this ETF would trade at around $160.
Though the trend (red line) is down, there was a double bottom in mid-February. We don’t know the long-term trend – and we don’t need to – but there is a possibility that the bounce could continue to resistance at $174.
I’ll show you why in a minute, but first I want to show you the other two ETFs I like for this trade.
This next one is tied to the S&P 500…
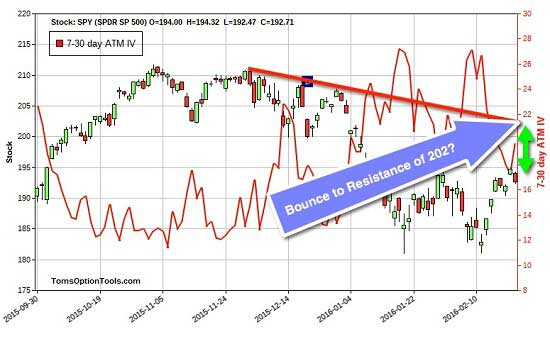
This ETF, like the DJX fund above, is cheaper than purchasing the index on its own. SPY trades at 1/10th the price of the S&P 500, meaning that if the S&P 500 was at 1,900, SPY would trade near $190.
This is one of the most liquid ETFs you can trade in this country, with bids and offers as tight as $0.01 – a penny. And options on this ETF are just as liquid, as they are one of the top options products traded worldwide.
Looking at the above chart, there was resistance last year at $210, and again at $208, to create that red downtrend line.
There is also a double bottom near $181, and a bounce shortly after. If the rally were to continue, expect the SPY to meet resistance levels at $202.
Now let’s have a look at the Nasdaq fund.
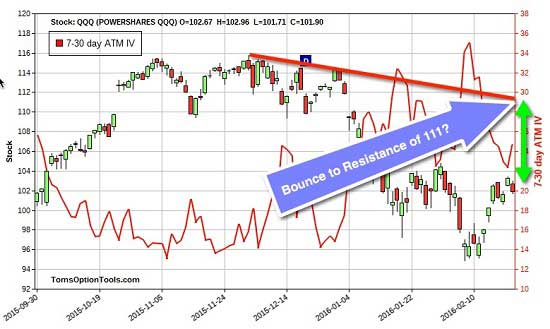
QQQ is an ETF that mimics the Nasdaq 100, the tech-centric index’s top 100 stocks.
Now, this ETF is weighted by market cap, and you’d better believe Apple Inc. (Nasdaq: AAPL) currently accounts for 11% of the fund; it’s the “heaviest” stock in the Nasdaq 100. This is contributing to the relatively bigger drop in the QQQ over the last three months.
As you can see in the chart above, the QQQ has resistance at $111, or about $9 (or “points,” in traders’ parlance) from where it sits currently.
Most of the technicals scream “Oversold!” but I’d like some more confirmation that this bounce is the real McCoy.
That’s where I turn to my “Money Calendar.”
What the Money Calendar Is Saying Now
Money Calendar is a tool that allows me to look at the top 400 stocks and ETFs for bullish and bearish short-term patterns.
These patterns are back-tested daily, spotting the best times to enter and exit these securities.
With better than 90% historical accuracy, and a minimum of 10 years on each back test, this really clears up the picture and culls the number of possible trades here to just a handful.
Here’s what I’ve seen as we approach the end of February.
The month of March has generally been good to the stock market. The indexes have moved higher in nine of the past 10 years.
Let’s take a look at one such pattern.
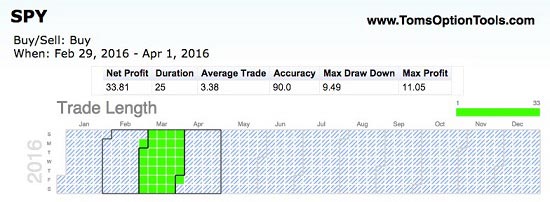
This Money Calendar shows a start date of Feb. 29, 2016, and an ending date of April 1, 2016, a one-month pattern with an average gain of 3.36%.
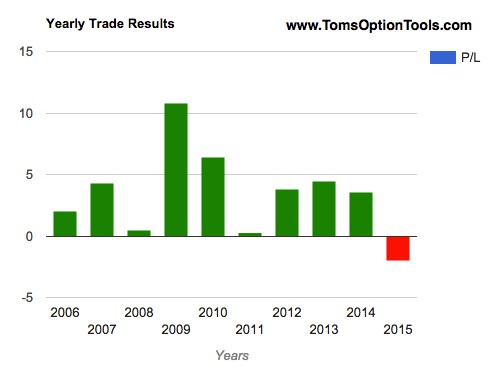
And here’s our confirmation: Over the last 10 years, the “March pattern” has held up, or been accurate, in nine of those years.
The pattern has only failed once in that decade, last year in 2015 when there was a 2-point drop. The best year this pattern had was in 2009, a year in which we saw massive gains coming out of the financial crisis.
With the markets coming off of oversold levels recently, the technicals are pointing to a short-term bounce.
Money Calendar patterns agree that the best chance of this bounce happening is in March.
There are no guarantees, but the percentages look good for the short term for the overall markets. It’s time to think about buying some in-the-money calls on these funds now for expiry in late March.
— Tom Gentile
[ad#mmpress]
Source: Money Morning
