

🚨 Trade Update: VKTX — First Price Target Hit ✅
We recommended Viking Therapeutics (NASDAQ: VKTX) on June 24, 2026, at a buy level of $35.50, with price targets of $42.00 (PT1) and $48.00 (PT2) and a stop-loss at $31.70 on a closing basis.
PT1 has been achieved — the stock closed at $42.13, comfortably above our $42.00 target, after hitting an intraday high of $42.79 — delivering a gain of approximately 19% from the entry level in just under two weeks. PT2 at $48.00 remains in play.
How to manage the position from here: Traders looking to de-risk may consider booking partial profits at current levels. Those with a higher risk appetite can continue holding with a trailing stop at $35.50 (our entry level), making the trade effectively risk-free while leaving room for the move toward PT2.
Bottom line: VKTX hit PT1 in just under two weeks for a ~19% gain — book partial profits or raise your stop to breakeven and let it run toward PT2 at $48.00. And now, on to today’s featured setup…
We flagged Vera Therapeutics, Inc. (NASDAQ: VERA) in our watchlist this past Sunday — and the stock has since broken out powerfully and looks headed even higher.
As we’ll get to just ahead, the combination of a major regulatory breakthrough, a fast-tracked path to full approval that puts it years ahead of schedule, and a fresh technical breakout makes VERA one of the more interesting setups on the board. Here’s what’s going on…
The Themes Behind the Move
Vera Therapeutics is a U.S.-based biotech focused on developing and commercializing treatments for immunological diseases, with its lead therapy targeting a serious kidney condition called IgA nephropathy (IgAN) — a disorder in which the immune system damages the kidneys’ filtering units and, left unchecked, is a leading cause of kidney failure.
In plain English, Vera’s flagship drug is a once-weekly at-home injection that switches off two of the key immune signals driving that kidney damage. Until this week, Vera was a clinical-stage company still waiting on regulators; that changed overnight. Its business now hinges on how quickly it can launch that drug commercially, how the confirmatory kidney-function data reads out later this year, and how it stacks up against a fast-growing field of competitors chasing the same market.
VERA’s latest move reflects a powerful confluence of developments — regulatory, clinical, and commercial — that have come together in rapid succession to fundamentally reframe the company’s near-term growth trajectory.
| Theme / Catalyst | What Happened | Why Traders Care |
|---|---|---|
| FDA accelerated approval for lead drug | On July 7, 2026, the FDA granted accelerated approval to Vera’s lead drug, TRUTAKNA (atacicept), for adults with primary IgA nephropathy at risk of progression. The nod was based on an interim analysis of the Phase 3 ORIGIN 3 trial, where the drug delivered a 46% reduction in proteinuria from baseline and a statistically significant 42% reduction vs. placebo (p<0.0001). | This transitions Vera from a pre-commercial biotech into a commercial-stage company overnight. It is the first and only approved therapy that targets both BAFF and APRIL — the two immune proteins that drive the disease — and its convenient at-home dosing differentiates it in a fast-growing market. |
| Full-approval timeline pulled years forward | In early June, Vera reached alignment with the FDA to run its pivotal kidney-function (eGFR) analysis from ORIGIN 3 in Q3 2026 instead of 2027. Pending positive data, the company plans a supplemental BLA (sBLA) filing in Q4 2026, setting up potential full approval in 2027. | The FDA agreeing to review 12-to-18-month data rather than the standard 24 months vastly narrows the gap against competitors and accelerates the path to a broader label. Just as importantly, a willingness to move faster signals FDA confidence in the size of the treatment effect. |
| Pipeline moat — monthly formulation | TRUTAKNA is currently a once-weekly subcutaneous injection, and Vera is advancing a monthly formulation, with topline data expected in H2 2026. | A monthly dosing option would sharply improve patient compliance and build a defensive moat against rival kidney-disease drugs — a differentiator that protects and extends the franchise well beyond the initial launch. |
| Sector tailwinds — the IgAN land rush | IgA nephropathy is one of the hottest areas in biotech, with large pharma paying up for assets — Vertex acquired Alpine Immune Sciences for $4.9B. The field is filling fast (Novartis, Travere, Otsuka, and Vertex’s povetacicept), yet unmet need and diagnosed prevalence keep rising. | Vera’s dual-action mechanism and convenient dosing position it as a prime acquisition target or blockbuster share-holder in a market where company and analysts see multi-billion-dollar peak sales potential. M&A appetite in the space adds a strategic-premium angle on top of the fundamental story. |
| Fundamentals & balance sheet | Vera holds roughly $597M in cash, cash equivalents & marketable securities (as of March 31, 2026), plus a $425M non-dilutive debt facility — expected to fund operations well beyond the U.S. launch. As a pre-revenue biotech, Q1 2026 showed a wider net loss than expected, typical ahead of a commercial launch. | A deep cash runway into 2027 materially reduces near-term dilution risk — a critical de-risker for a company transitioning to commercial stage, letting management fund the launch without tapping the market at depressed prices. |
| Analyst coverage | Among the 12 analysts covering VERA, the average twelve-month price target sits at $78.40, with a high target of $110.00 and a low of $33.00 — the average implying roughly 82% upside from current levels. Recent actions are constructive: Goldman Sachs reiterated Buy ($90), Wolfe Research upgraded to Outperform ($88), Raymond James maintained Strong Buy ($78), and TD Cowen maintained Buy ($73). | An average target more than 80% above the current price — with a cluster of Buy-rated Tier-1 banks stacked in the $73–$90 range — signals a coverage universe that sees the post-approval story as materially undervalued rather than fully priced. |
| Upcoming triggers | Traders are watching Q2 2026 earnings on August 4/6, the critical Phase 3 eGFR data readout in Q3 2026, H2 topline data for the monthly formulation, the intended Q4 2026 sBLA filing, the mid-2026 U.S. commercial launch of TRUTAKNA, and ongoing PIONEER Phase 2 data. | A staggered set of high-conviction catalysts — earnings, the confirmatory kidney-function readout, launch metrics, and pipeline data — each capable of independently moving the stock through the back half of 2026 and into 2027. |
If needed, swipe or scroll sideways to view the full table.
Put it all together, and VERA is looking less like a speculative pre-approval biotech leaning on trial hopes and more like a freshly de-risked, commercial-stage franchise with an approved first-in-class drug, an FDA-blessed fast track to full approval, a deep cash runway, and a field of deep-pocketed acquirers circling the space.
The story is getting stronger by the week, but the chart is what could determine whether this move has more room to run in the near term. Here are the bullish technical signals traders should be watching now.
Bullish Technical Signals
#1 Downtrend Channel Breakout: VERA spent the last several weeks compressing inside a well-defined descending channel (marked in purple on the daily chart). That structure is now broken. Price pushed through the upper rail with conviction, pulled back cleanly to retest the breakout level, and is turning higher off that retest — the textbook sequence that separates a durable breakout from a false one. A descending channel gives way only when buyers have absorbed every layer of overhead supply the channel was feeding them and are still bidding higher. The successful backtest is the confirmation: former resistance is now acting as support. This reframes the prior decline as a corrective phase inside a larger uptrend, not the opening leg of a sustained move lower.
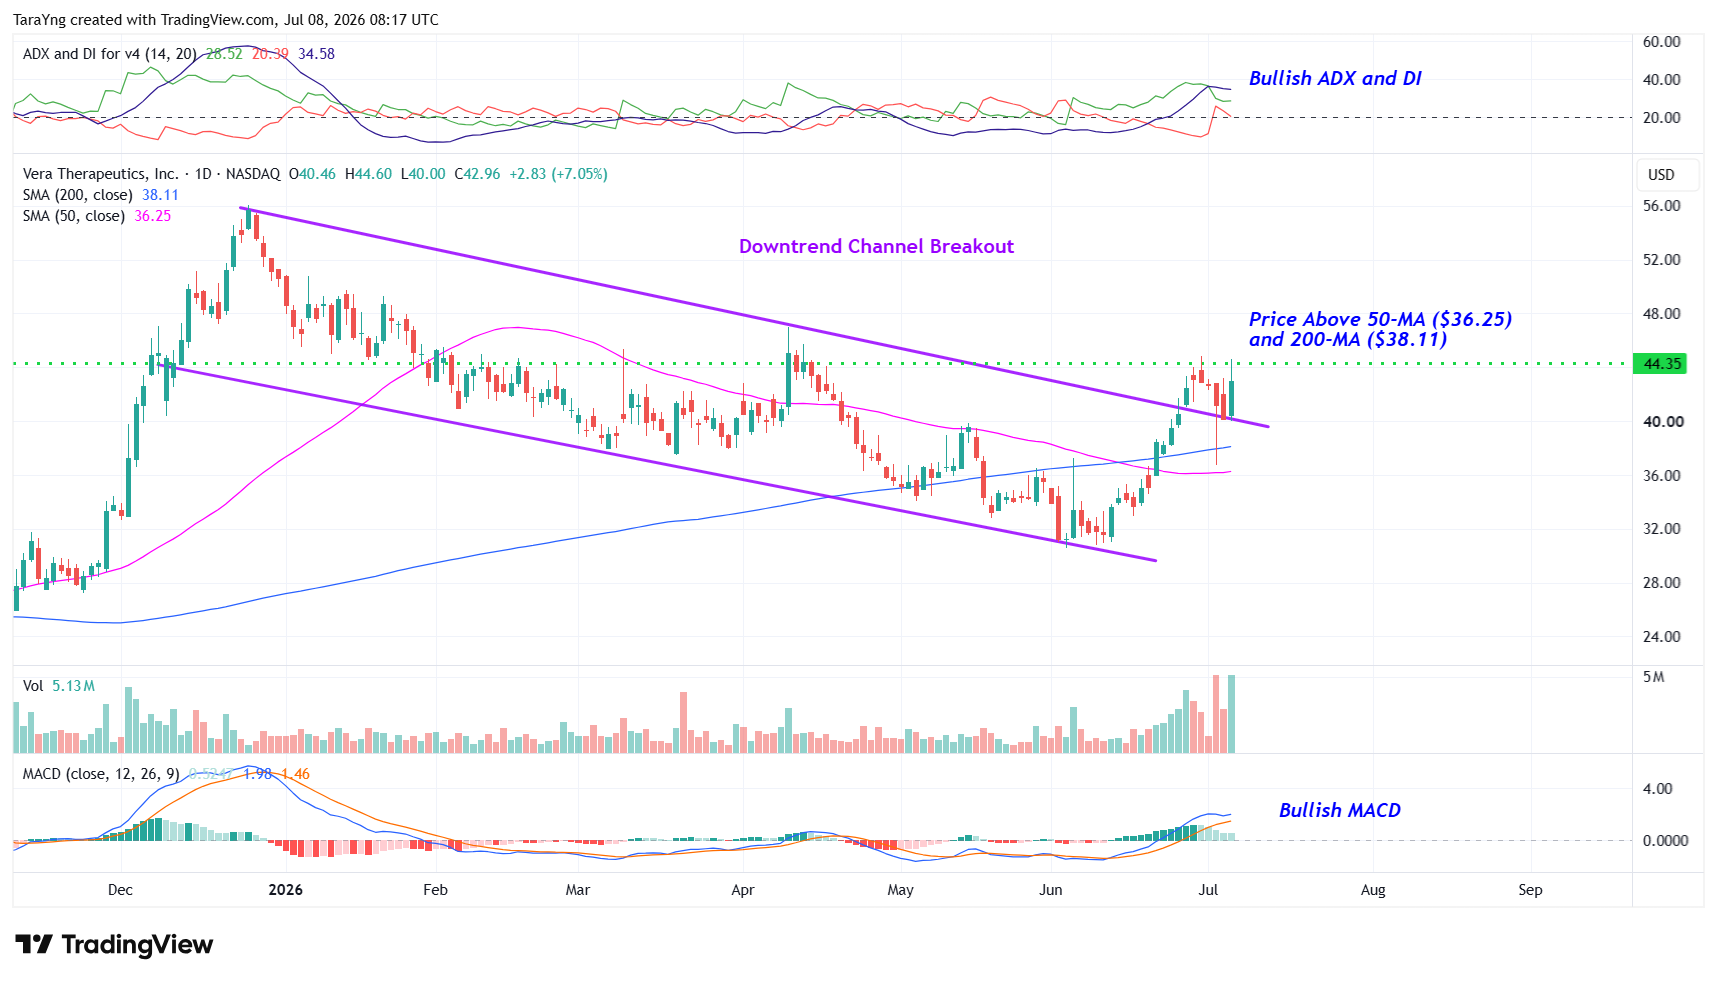
VERA – Daily Chart
#2 Price above MAs: VERA is trading above both the 50-day and 200-day SMAs, placing it firmly in bullish territory on the daily timeframe. More telling is how the two averages sit: tightly clustered just beneath price, with the 50-day ($36.25) closing in on the 200-day ($38.11) from below. That compression is what a market looks like after it has finished digesting overhead supply and is coiling for a directional resolution — and with price already above both, the resolution is tilting up. The clustered MAs also give buyers a defined, layered support zone to lean on if the stock pulls back.
#3 MACD Above Signal Line: On the daily, the MACD line (light blue) has crossed above its signal line (orange) and both are lifting off the zero line together — a bullish crossover with the added weight of coming from a compressed base rather than an extended one. The read is straightforward: short-term momentum is accelerating faster than longer-term momentum, meaning buying pressure is not just present but expanding. Crossovers that fire from a flat base tend to have more runway than those that fire when the indicator is already stretched, which is what makes this particular signal worth acting on rather than fading.
#4 Bullish ADX: The ADX read here is textbook early-trend, and two things stand out. First, +DI has crossed decisively above –DI, locating directional pressure firmly on the buy side. Second — and the more important read — ADX itself is inflecting higher from a compressed base beneath both DI lines. Because ADX is direction-agnostic and measures only trend strength, a rise from a low reading is the indicator’s way of saying a new trend isn’t just forming, it’s gathering force. The fact that ADX is still climbing rather than curling over matters: a flattening ADX at these levels would read as exhaustion; a rising one reads as runway. Stacked against the channel breakout and MACD crossover, all three momentum reads are pointing the same direction — and that alignment is what elevates this from a single signal to a confluence.
#5 Cup and Handle Pattern Breakout: Zooming out to the weekly, VERA has broken out of a cup and handle — one of the most reliable long-term continuation patterns in technical analysis. The rounded “U” of the cup reflects an orderly, months-long absorption of selling pressure; the shallow drift lower that formed the handle acted as a final shakeout of weak hands before the move higher. The breakout above handle resistance is the confirmation that institutional participation has stepped in, and the pattern’s depth and duration point to the potential for a sustained, multi-week advance rather than a short-lived pop. Reinforcing the setup, price is trading well above both the 50-week ($36.11) and 200-week ($27.81) SMAs, confirming the higher-timeframe trend structure is aligned with the breakout.
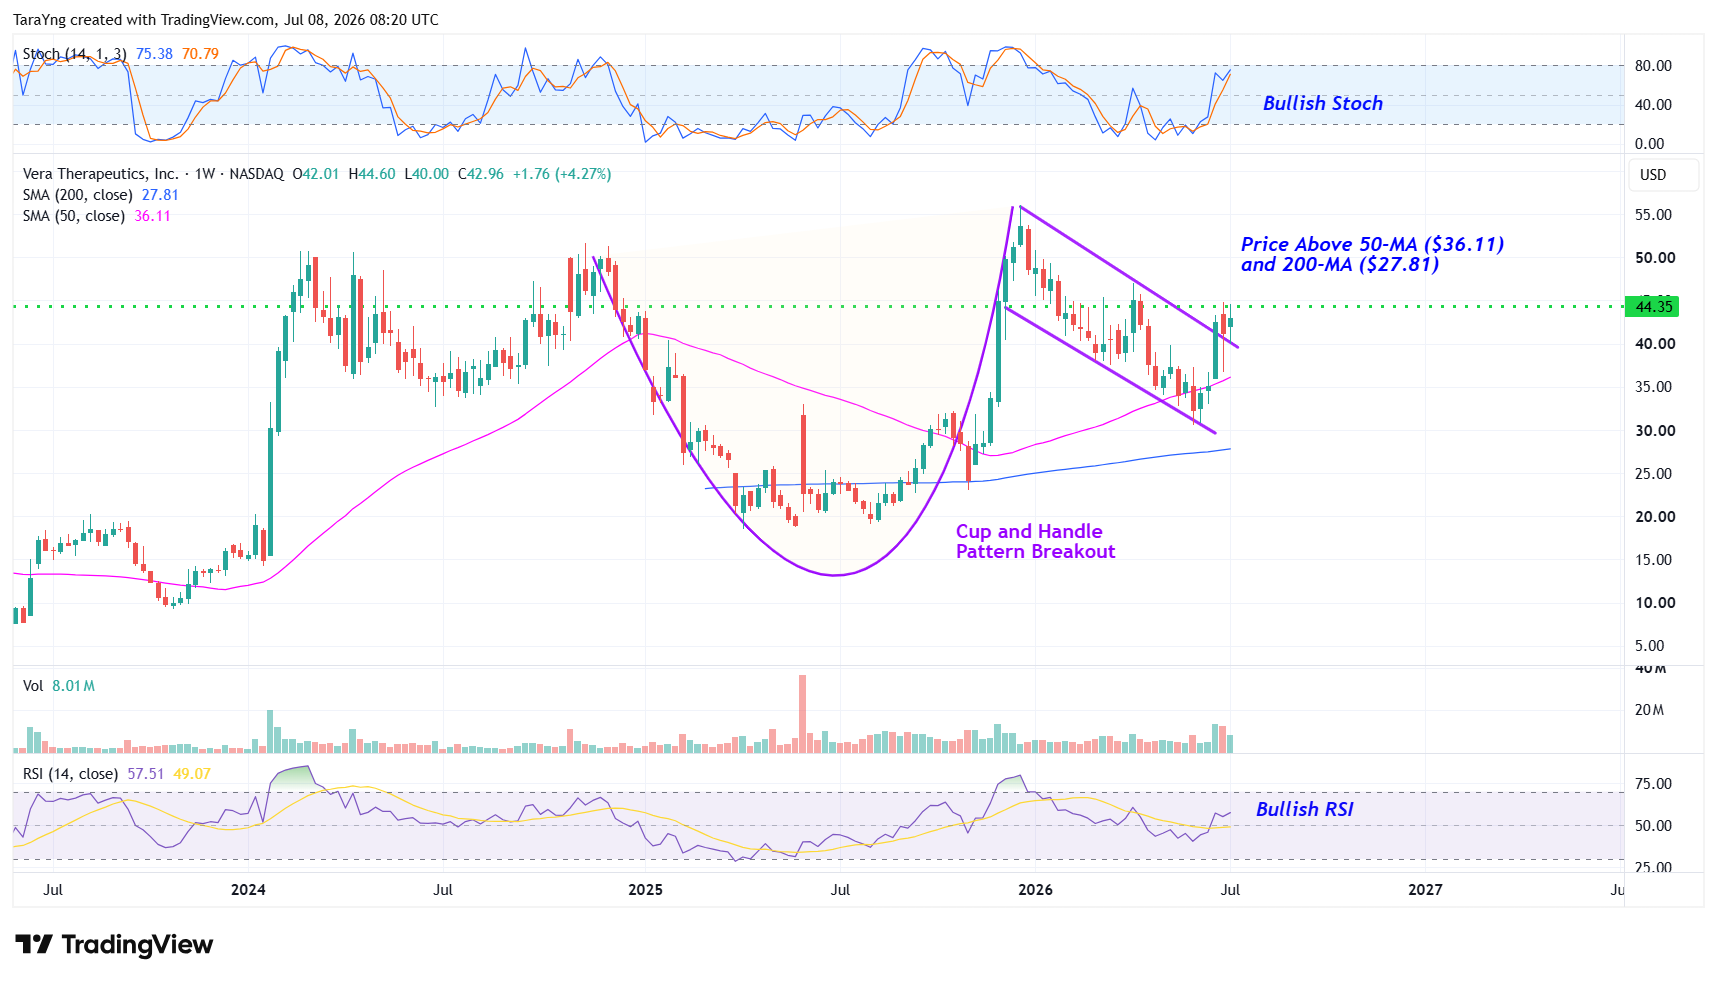
VERA – Weekly Chart
#6 %K above %D: On the weekly, %K has crossed above %D and is rising out of the mid-range — a signal that buying momentum is overtaking selling pressure on a longer-term basis. Two things give this crossover added weight. First, the timeframe: weekly stochastic signals filter out the intraweek noise that muddies daily reads, so a crossover here reflects a genuine shift in momentum rather than a short-lived swing. Second, the location: the cross is firing from the middle of the range rather than from overbought territory, meaning there’s room for the signal to develop before any exhaustion risk enters the picture.
#7 Bullish RSI: The weekly RSI has cleared 50 and continues to trend higher — a two-part confirmation that carries more weight than either read alone. Crossing 50 signals that buyers now hold the momentum advantage over sellers on the higher timeframe; the continued upward trajectory tells us that advantage is expanding, not plateauing. An RSI simply sitting at 50 is a coin flip; an RSI that has crossed 50 and is still climbing is a directional statement. Combined with the cup-and-handle breakout and the weekly stochastic cross, the higher-timeframe momentum picture is unambiguously constructive.
Risks to Consider
Even strong setups can fail, especially in a volatile clinical-stage-turned-commercial biotech like Vera. A few things could knock the stock off course:
- A breakdown back below the trend-channel breakout level on heavy volume would invalidate the bullish technical thesis
- Negative company-specific news, broader market weakness, or a sector rotation out of biotech would pressure the entire IgAN group
- Confirmatory data risk — the accelerated approval hinges on positive Q3 2026 eGFR kidney-function data to support full approval and label expansion; a disappointing readout would be a major setback
- Commercial execution risk — going from the lab to selling a drug is hard; Vera must build out a sales force and secure insurance coverage with a brand-new launch team and high post-rally expectations
- Insider selling — in late June 2026, CEO Marshall Fordyce sold roughly $701,000 of stock (18,500 shares); this was a scheduled 10b5-1 plan and a fraction of his holdings, and institutions loaded up over $200 million in VERA earlier this spring, but the activity is a sentiment item to watch
- Profitability timeline — Vera is pre-revenue until commercial launch, and continued heavy spend on the launch could widen losses before revenue scales
- Competition — the IgAN space is crowded, with Otsuka, Vertex’s povetacicept (strong Phase 3 data), and Novartis (whose sibeprenlimab posted a slightly higher 51.2% protein reduction in separate trials) all vying for share
- Regulatory or sector-level risk — any shift in FDA posture, reimbursement, or the broader biotech tape could weigh on the stock regardless of company-specific execution
The Bottom Line
VERA is breaking out of a multi-week descending channel on the daily chart while also clearing a long-term cup-and-handle pattern on the weekly — a dual-timeframe technical setup that historically signals the start of a sustained move higher.
The fundamental story underneath the chart is just as strong: a first-in-class FDA accelerated approval for its lead drug, an FDA-blessed fast track that pulls full approval years forward, and a deep ~$597M cash runway funding operations into 2027.
Combine that with multiple commercial and clinical catalysts staggered through the back half of 2026 and into 2027 — Q2 earnings in August, the confirmatory Q3 eGFR readout, the mid-2026 commercial launch, monthly-formulation data, and the planned Q4 sBLA filing — and VERA looks like one of the more compelling risk-reward setups on the board right now.
If this is a trade you want to get in on, here’s how we’d play it. Below you’ll find our exact entry level, both price targets that imply 22%–35% potential upside, and the stop-loss we’re using to manage the downside.
Recommended Trade Setup
| Item | Detail |
|---|---|
| Buy Level | Above approximately $44.40 |
| Price Target 1 | $54.00 — Potential upside: 22% |
| Price Target 2 | $60.00 — Potential upside: 35% |
| Timeframe | Next 3–6 months |
| Stop-Loss | $39.50 on a closing basis |
| Trade Invalidation | Void if price hits stop-loss before entry triggers |
If needed, swipe or scroll sideways to view the full table.
For a risk of approximately $4.90 per share, the target rewards are about $9.60 and $15.60 per share. That makes this roughly a 1:2 and 1:3 risk-reward trade. In other words, the setup offers nearly 2x to 3x more potential upside than downside.
Note on Trade Invalidation: This recommendation stays active as long as the technical structure holds. If VERA drops to or below the $39.50 stop-loss before the $44.40 entry triggers, the trade is automatically void — the support underpinning the thesis would have broken, and the risk-reward setup would no longer justify entry.
Happy Trading!
Tara and Greg
🥈 Almost Made the Cut
Today’s featured trade, Vera Therapeutics (NASDAQ: VERA), was our top pick of several breakout candidates we evaluated. The following two stocks were strong candidates that made it to the final round — they came up just short of the top spot, but remain on our watchlist and could be featured soon:
Immix Biopharma, Inc. (NASDAQ: IMMX) — One of the most technically impressive names we reviewed, supported by a powerful breakout, strong relative strength, and unusually subdued options pricing ahead of a significant clinical catalyst. Enthusiasm is building around NXC-201, which has shown a remarkable 95% complete response rate in relapsed/refractory AL amyloidosis with no reported relapses in interim data; upcoming NEXICART-2 topline results could drive substantial upside — but because the thesis still hinges on a single binary clinical event, IMMX finished just behind VERA.
Agios Pharmaceuticals, Inc. (NASDAQ: AGIO) — Combines the stability of an established rare-disease franchise with an attractive regulatory growth story, as commercial adoption of AQVESME (mitapivat) provides a solid base while its FDA Priority Review for sickle cell disease and expanding hematology pipeline set up further value creation. With improving technical momentum and renewed institutional interest heading into its November FDA decision, AGIO is compelling — but with that primary catalyst falling just beyond our preferred 14-week window, VERA offered the stronger near-term risk-reward.
