
When you’re stuck at home day in and day out, your thoughts tend to wander. And mine have been stuck on this market.
We’re more than 20% down from recent market highs – the flat-out definition of a bear market.
But at the same time, stocks have begun to rally. As I’m writing, we’re around a 20% retracement from recent market lows as well.
Now, typically, I wouldn’t buy this rally. But it’s definitely testing me…
Are we in the midst of a bear market or a bull market? Each side has a solid argument backing it up – so today, I’m using three charts to show you where I see stocks headed next…
Is This a Bull or Bear Market?
First off, I believe this is, in fact, a bear market.
The first chart I’m looking at is of the Dow Jones Industrial Average as it moved higher from August of last year to February of this year, before the big drop.
Interestingly enough, within the last week, we have posted a low, and we’ve retraced back. The three numbers on my chart – 38%, 50%, and 61% – are what we call Fibonacci Retracement Levels.
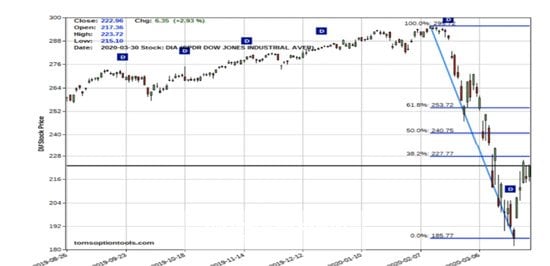 On the DIA, which is the Dow Jones ETF, 227.77 is the first area of resistance, then 240.75 is at the 50% retracement, and 253.72 is at the 61% retracement.
Recently, we put a high in just below the area of the 38% retracement, which means we retraced back 38% of this drop – or came very close to it.
Time will tell whether we hit 38% and then resume the downtrend, hit 50% and resume the downtrend, hit 61% and then resume the downtrend – or blow through all three of them and make a V-shaped bottom.
I’m thinking the lowest probability is a V-bottom, especially when you see all the fundamentals out there.
But let’s assume, for a moment, that we are in the midst of a bear market.
The question to ask is, how long is this likely to last?
Bear Market History Lesson
Looking at a chart from William O’Neil and Co., we can see all the bear markets between their start and their end dates. This is from the high to low, starting from 1929, then going to 1931, and the bear market of 1932.
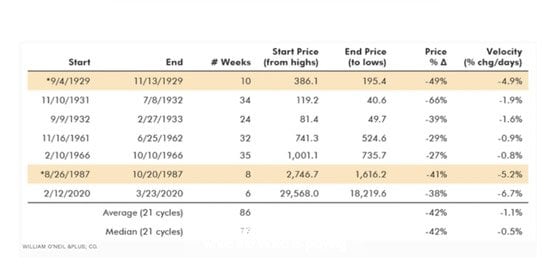 Next we had a bear market in 1961, 1966, and then one in 1987, which most of us know very well. And of course, this year, 2020.
Each of these had a different length of time that it took for those bear markets to complete, calculated in number of weeks.
The shortest-term cycle was the bear market of 1987, which lasted for eight weeks. The longest was the cycle that started in 1966 and ran through the majority of the year, lasting for a total of 35 weeks.
If you look and see where we are right now, we’re only six weeks into the current bear market.
So, averaging all of this up, we really look like we’re only about a third of the way in, which would put us out to sometime in October or November if we were to use the law of averages.
The other thing I want to mention to you is price and the average move that’s happened.
Now, going forward through all of these bear market cycles, with the exception of 1961 and 1966, we posted losses of near 30%. The worst was in 1931 to 1932, when the Dow dropped a whopping 66% during that bear market.
We dropped 38% on the Dow since this started on Feb. 12 to March 23, which is the latest end date recorded on this chart. Is that the low? It very well could be.
But the thing is, if you go and look at what has happened during each of these other bear market cycles, while there were a few that were less, the majority of these took much longer than the six weeks that we’ve seen the market drop.
So I do believe that we’re still in the midst of seeing at least a retest of the lows.
A Critical Bear Market Comparison
And finally, if we look at my bear market comparison chart, we’ll be able to see the most telling part of this.
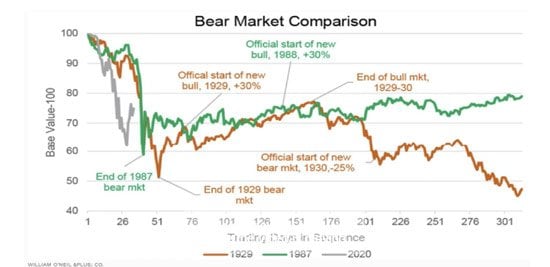 Starting at the top left-hand side, you can see the year 1929 indicated with the orange line where it had a big drop that happened during the trading days. 50 days in was the big drop, then we had a pullback that lasted for a 176 days, and then, nearly nine months later, we followed through and hit a new low.
Now looking at the year 1987, which is indicated with the green line, the drop took less than 40 days.
Then we moved sideways for a while before slowly starting to slope out. And then you can see that very soon after, we started to see a retest of lows.
The most important part of this whole thing is that we had a drop in both cases, and then within the following one to two months after, we had a rollover where we started to retest those lows both in 1929 and in 1987.
Is that the case with this bear market we’re in? If the answer is yes, then we’ve got at least a couple more months before we do get out of this funk and start moving one way or another. Till then, we could be in a very choppy environment before either the bulls or the bears are proven right.
Naturally, the next question to ask is, what do you do in a case like this?
Well, that takes me through my three-step guide for trading through a world crisis. We’ve been talking about this now for the past two months, and I have to reiterate it here again.
Step One: Take less risk in your current strategies. You don’t need as much money in the market to get the same returns with the kind of volatility we have.
Step Two: Look at what’s going up in a down market. And these would even include put options on stocks in the travel industry and the energy markets, for example, which are still getting hurt very badly, even with what’s happened in the last week.
Step Three: Exploit volatility. This makes the most sense with volatility as high as it is. If you’re an options trader, you don’t want to be buying calls if you’re bullish. You also don’t want to be just buying puts if you’re bearish. You want to be using spreads and using that option volatility and time premium in your favor.
And no matter where we are in this bear market and how long it may last, keep in mind that it’s still a tradeable market.
— Tom Gentile
Source: Money Morning
