
NOW is the time to buy.
Last week, I told you stocks were gearing up for a year-end rally.
December is typically a strong month for stock prices.
Since 1930, the S&P 500 has gained ground in December 72.9% of the time – with an average return of 1.4%.
[ad#Google Adsense 336×280-IA]Most of those gains came in the second half of the month. And they often came AFTER the market had spooked traders by declining during the first half of the month.
Friday’s big drop spooked a lot of folks who were already nervous going into this week’s Federal Open Market Committee (FOMC) announcement.
At Friday’s close, the S&P 500 was down 4% for the month.
Many folks have given up on the idea of a year-end rally.
Don’t be one of those folks. We could see an explosive move higher in the next two weeks…
Friday’s action pushed a lot of technical indicators into extremely oversold territory. For example, take a look at the NYSE McClellan Oscillator (NYMO)…
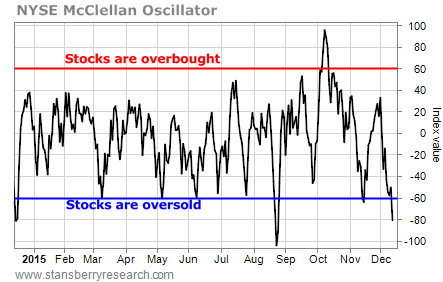
The NYMO is a momentum-based indicator that helps determine overbought and oversold conditions on the New York Stock Exchange. Readings of more than 60 indicate severely overbought conditions and often precede large declines in the markets. Readings below -60 display extremely oversold conditions and usually lead to strong bounces in stock prices.
On Friday, the NYMO closed at -80. That’s the second-most-oversold level of the year. The lowest reading occurred in August, just before the S&P 500 rallied 6% in one week. The S&P 500 also rallied 6% in about two weeks last December after the NYMO dropped to -80.
The Nasdaq McClellan Oscillator shows a similar condition…
_DJDY5SRYYL.png)
On top of this, the Volatility Index (VIX) – the market’s fear indicator – closed Friday above its upper Bollinger Band. Take a look…
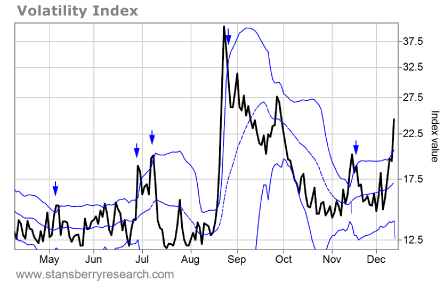
Bollinger Bands help to define the most probable trading range for a stock or an index. When a chart breaks outside of that range, it indicates an extreme move – one that is likely to reverse, at least in the short term.
The VIX closed well above its upper Bollinger Band on Friday. The blue arrows on the chart show the previous times this year that the VIX has been in a similar condition. Each time, the VIX dropped back inside the bands within a few days. And that action has always triggered a short-term rally in stock prices.
Here’s how the S&P 500 performed each time…
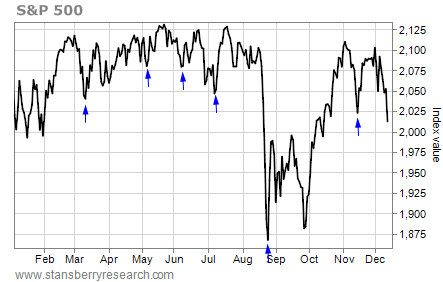
In every case, the S&P 500 was higher in just a few days.
As you probably know, my longer-term outlook for the stock market is bearish. I suspect the S&P 500’s May high will prove to be the top for this aging bull market. And 2016 will be a tough year for stocks.
But in the short term, I’m bullish.
Stocks tend to rally in the second half of December. And we now have the type of extremely oversold conditions that typically occur before a strong stock market bounce. Now is the time to buy.
Best regards and good trading,
Jeff Clark
[ad#stansberry-ps]
Source: Growth Stock Wire
