
The gold-stock rally may have just kicked off.
As I told you earlier this month, gold stocks have been following the same sort of bottoming action we saw last November and December – right before the sector rallied 20% in just a few weeks.
Last week’s action continued that pattern…
Here’s an updated look at the chart of the Market Vectors Gold Miners Fund (GDX)…
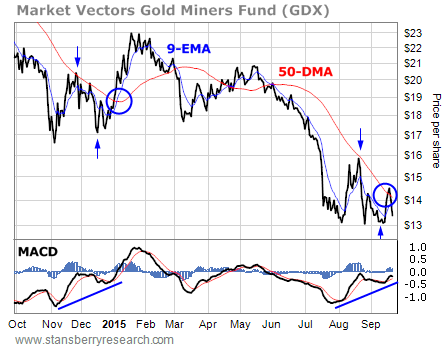
We’ve been watching this pattern develop for the past several weeks.
[ad#Google Adsense 336×280-IA]The steep decline in July was similar to what occurred last October.
Then we got a sharp bounce in August, back up to kiss the 50-day moving average (DMA) from below, just as GDX did last November.
That bounce was followed by another drop back down to retest the lows.
And last week, GDX finally exploded higher and broke out above its 50-DMA.
All that remains to confirm the rally phase is for the nine-day exponential moving average (EMA) to complete a bullish cross over the 50-DMA.
When that happened in January, GDX rallied 20% in less than one month. A similar move this time would have GDX trading up near the $18 level by Halloween.
That’s a lot to ask for, of course. And there are no guarantees that the current pattern will play out the same way GDX behaved in January. But the similarities are there. And with the gold sector as deeply oversold as it is, there’s plenty of energy to fuel a sharp rally.
It’s not just the chart of GDX that shows a good setup for a rally. Take a look at this chart of the Gold Miners Bullish Percent Index (or “BPGDM”)…
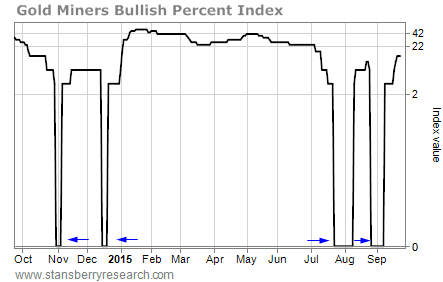
A bullish percent index helps determine overbought and oversold conditions for a sector. It measures the percentage of stocks in a sector that are trading with bullish point-and-figure chart patterns. Since it’s a percentage, the chart can range anywhere from zero to 100.
For most sectors, readings of more than 80 indicate overbought conditions. Readings of less than 30 indicate oversold conditions. Sell signals occur when the BPGDM rallies above 80 and then turns lower. Buy signals happen when the BPGDM drops below 30 and then turns higher.
The BPGDM traded as low as zero just a couple of weeks ago. This means there were no stocks in the gold sector that were trading in a bullish technical pattern. It is not mathematically possible to get worse than that.
Notice also that the BPGDM hit zero back in August as well. So we’ve had two readings of zero on the BPGDM and two bounces off that level in the past six weeks.
Now, look at the action in the BPGDM last November and December. It’s identical to what we’re seeing today. It took two bounces off the zero level in the BPGDM to trigger a new rally phase for gold stocks.
Both the GDX chart and the BPGDM chart support the potential for a sharp rally in the gold sector. In short, gold stocks could be sharply higher one month from now.
Best regards and good trading,
Jeff Clark
[ad#stansberry-ps]
Source: Growth Stock Wire
