
 Gold stocks have gone nowhere for the past eight weeks. But that’s about to change…
When we last looked at gold stocks in October, I said the benchmark Market Vectors Gold Miners Fund (GDX) may need to consolidate for a few weeks before attempting a new rally.
That’s exactly what has been happening. GDX has been trading back and forth in a tight range – storing up energy for its next big move. And the move is about to start…
Take a look at this chart of GDX…
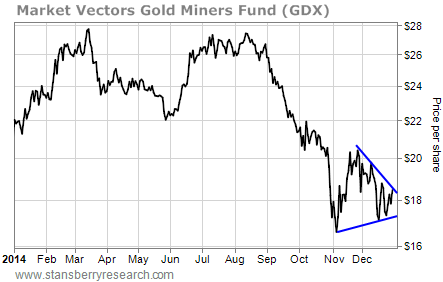 GDX is in a consolidating-triangle pattern (the blue lines on the chart). A consolidating-triangle pattern is a series of higher lows and lower highs on the chart. This pattern typically occurs following a large move in a stock, and it allows the stock to build up energy for its next big move.
[ad#Google Adsense 336×280-IA]The support and resistance lines are now pinching together and GDX is nearing the apex of the triangle.
So we’re going to see GDX break out of this pattern – one way or another – soon.
The height of the triangle measures 3.5 points – from $16.50 per share to $20 per share.
So if GDX breaks above the resistance line of the triangle (currently at about $18.60 per share), we’ll have a new rally phase with a target of about $22.10 per share.
That’s also the point of the October high, which is a logical area for GDX to run into resistance.
On the other hand, if GDX breaks below the support line of the triangle – at about $17.20 per share – we’ll be looking at another wicked selloff in the gold sector. The pattern suggests a downside target of $13.70 per share.
There’s no way to know ahead of time which way GDX will break. But traders should be ready to react either way.
Best regards and good trading,
Jeff Clark
[ad#stansberry-ps]
Source: Growth Stock Wire
