
Cytokinetics, Incorporated (NASDAQ: CYTK) just broke out to a 52-week high and looks headed even higher.
As we’ll get to just ahead, the combination of a landmark Phase 3 trial success, accelerating U.S. and European commercial launches, and a fresh technical breakout makes CYTK one of the more interesting setups on the board. Here’s what’s going on…
The Themes Behind the Move
Cytokinetics is a late-stage biotech developing and selling cardiac myosin inhibitors — a category of drugs that target the underlying biology of hypertrophic cardiomyopathy (HCM), a serious heart condition.
In plain English, its lead drug aficamten (brand name MYQORZO) helps the heart pump more efficiently in patients with thickened heart muscle — which means its business hinges on commercial uptake of MYQORZO, regulatory approvals across new patient populations, and how its drug stacks up against Bristol-Myers Squibb’s competing therapy.
CYTK’s latest move reflects a powerful confluence of developments — clinical, commercial, and regulatory — that have come together in rapid succession to fundamentally strengthen the long-term story.
| Theme / Catalyst | What Happened | Why Traders Care |
|---|---|---|
| Landmark Phase 3 win in nHCM | Cytokinetics announced positive topline results from the pivotal Phase 3 ACACIA-HCM trial of aficamten in patients with non-obstructive hypertrophic cardiomyopathy (nHCM), with the trial meeting both dual primary endpoints at Week 36. | This is the first positive Phase 3 readout ever in nHCM — a population where Bristol-Myers Squibb’s competing drug previously failed. It massively expands the addressable market for aficamten and de-risks the entire franchise heading into a likely supplemental NDA filing with the FDA. |
| Accelerating commercial launch | The U.S. launch of MYQORZO for obstructive HCM has gathered real steam, with 1,100+ patients on therapy through April, 275+ unique prescribers, and over 1,400 REMS-certified physicians. The European Commission has also approved the drug, with a Germany launch planned for Q2 2026. | Strong launch metrics this early into commercialization tell traders the demand is real and the salesforce is executing — turning aficamten from a promising late-stage asset into a revenue-generating franchise with multi-region growth runway. |
| Market conviction signal | On May 5, Cytokinetics announced a $650 million public stock offering the same day as the ACACIA-HCM Phase 3 results — a classic “sell the news plus dilution” setup that usually pressures shares. Instead, CYTK closed sharply higher and hit a 52-week high. | When a stock absorbs both binary clinical-data risk and equity dilution in a single session and still pushes to new highs, it tells traders that institutional money is aggressively accumulating into strength — a signal that often marks the beginning of sustained moves. |
| Sector tailwinds | Broader cardiovascular innovation is having a moment, and aficamten — with its differentiated dosing profile and now first-in-class nHCM data — is strengthening the entire myosin-modulator category. The 2026 biotech funding rebound provides macro support for late-stage cardio assets with clear clinical and commercial momentum. | Sector backdrop matters — names that are already executing inside hot themes tend to outperform peers, and CYTK now sits at the intersection of two: a category that’s expanding and a market that’s rewarding clinical execution. |
| Strengthened balance sheet | Even after Q1 cash burn, CYTK ended the quarter with roughly $882 million in cash, and the recent $650M offering pushes that number toward the $1.1 billion range. 2026 R&D + SG&A guidance was maintained at $830–$870M. | A cash position of this size gives Cytokinetics the runway to fully fund the European launch, the potential nHCM regulatory submission, and ongoing pipeline development — without forcing additional dilution at unfavorable prices later. |
| Analyst coverage | Among the 22 analysts covering CYTK, the average 12-month price target sits at $92.10, with a high of $136.00 and a low of $56.00 — implying roughly 19% upside to the mean and as much as 76% upside on the high end from recent levels. | Broad analyst coverage with a high-end target near $136 signals that the most bullish names on the Street see meaningful re-rating potential as the nHCM data filters through models and the commercial ramp accelerates. |
| Upcoming triggers | Traders are watching the ESC Heart Failure 2026 Congress in May (where Cytokinetics is presenting nine studies), the Q2 2026 Germany launch, the November 14 PDUFA date for the MAPLE-HCM sNDA, and Q4 2026 completion of the adolescent cohort enrollment. | Multiple staggered catalysts give CYTK a steady drumbeat of potential upside drivers through year-end — and any positive label expansion from the November PDUFA could meaningfully widen the addressable patient population for aficamten. |
If needed, swipe or scroll sideways to view the full table.
Put it all together, and CYTK is looking less like a speculative late-stage biotech and more like a commercially executing cardiovascular franchise with first-in-class clinical data, accelerating launch metrics, and a fortified balance sheet underwriting the next leg of growth.
The story is getting stronger by the week, but the chart is what could determine whether this move has more room to run in the near term. Here are the bullish technical signals traders should be watching now.
Bullish Technical Signals
#1 Breakout from Consolidation Area: After consolidating within a well-defined range for several months — marked by the purple rectangle on the daily chart — CYTK has staged a decisive breakout to the upside, confirmed by a significant surge in volume. This type of high-volume breakout carries more conviction than one on thin trading, as it signals broad market participation behind the move. The upper boundary of the former consolidation zone now flips to a key support level, providing a natural reference point for risk management.
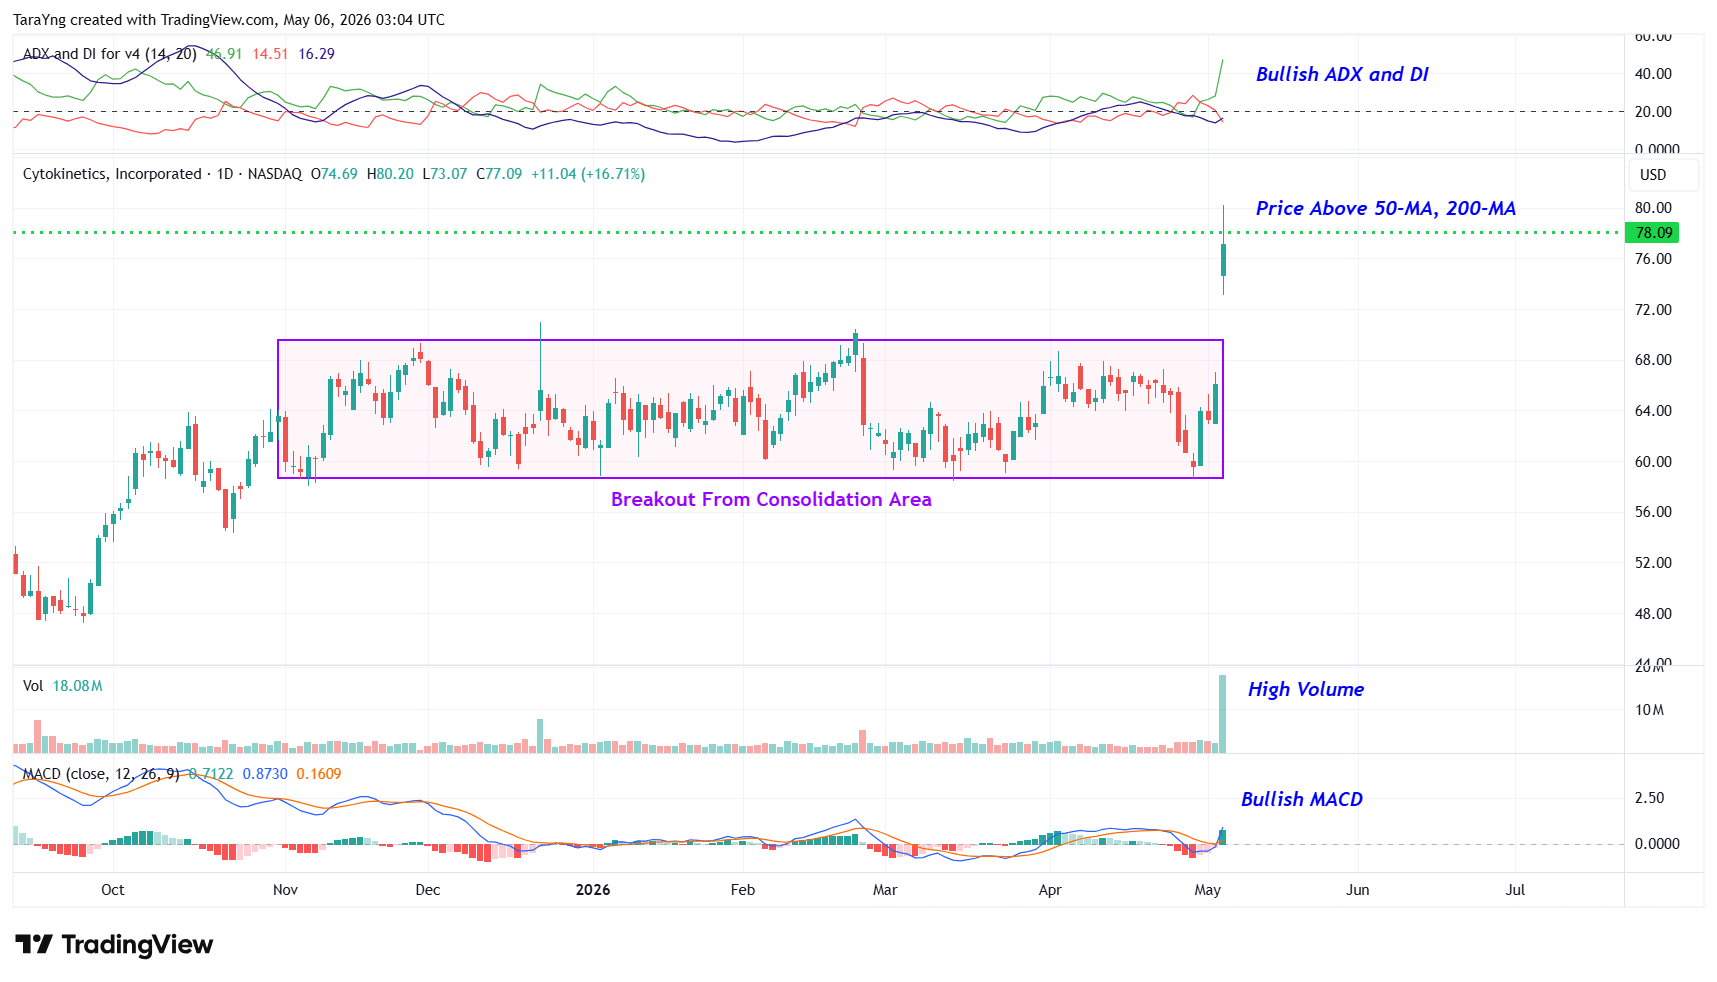
CYTK – Daily Chart
#2 Price above MAs: CYTK is trading above both its 50-day and 200-day SMAs. This is a classic sign that the bulls are structurally in control across both short- and long-term timeframes. Beyond directional bias, these MAs serve as dynamic support levels: should the stock pull back, traders often look to these levels as areas to add exposure. Price holding above both MAs strengthens the bull case.
#3 MACD Above Signal Line: On the daily chart, the MACD line has crossed above the signal line, a bullish crossover that indicates short-term price momentum is accelerating relative to the longer-term trend. The histogram turning positive reinforces this shift, reflecting expanding buying pressure. Taken together, this crossover suggests the path of least resistance is to the upside on the daily timeframe.
#4 Bullish ADX: The ADX indicator shows that the +DI line is currently above the –DI line and the ADX line has moved up from below the –DI line. The +DI above –DI shows buyers control the trend direction, while the ADX is moving up from below –DI toward +DI. When ADX rises in this configuration, it typically points to a new or accelerating uptrend, not just a bounce. This adds meaningful conviction to the breakout.
#5 Above Support Area: As you can see from the weekly chart, CYTK has bounced cleanly off a key resistance-turned-support level at approximately $68 (marked by the pink dotted line). This is a textbook technical setup where a former ceiling becomes a floor. The stock is also trading above both its 50-week and 200-week SMAs, confirming that the longer-term trend structure remains firmly bullish. This weekly support confluence gives the breakout a strong macro foundation.
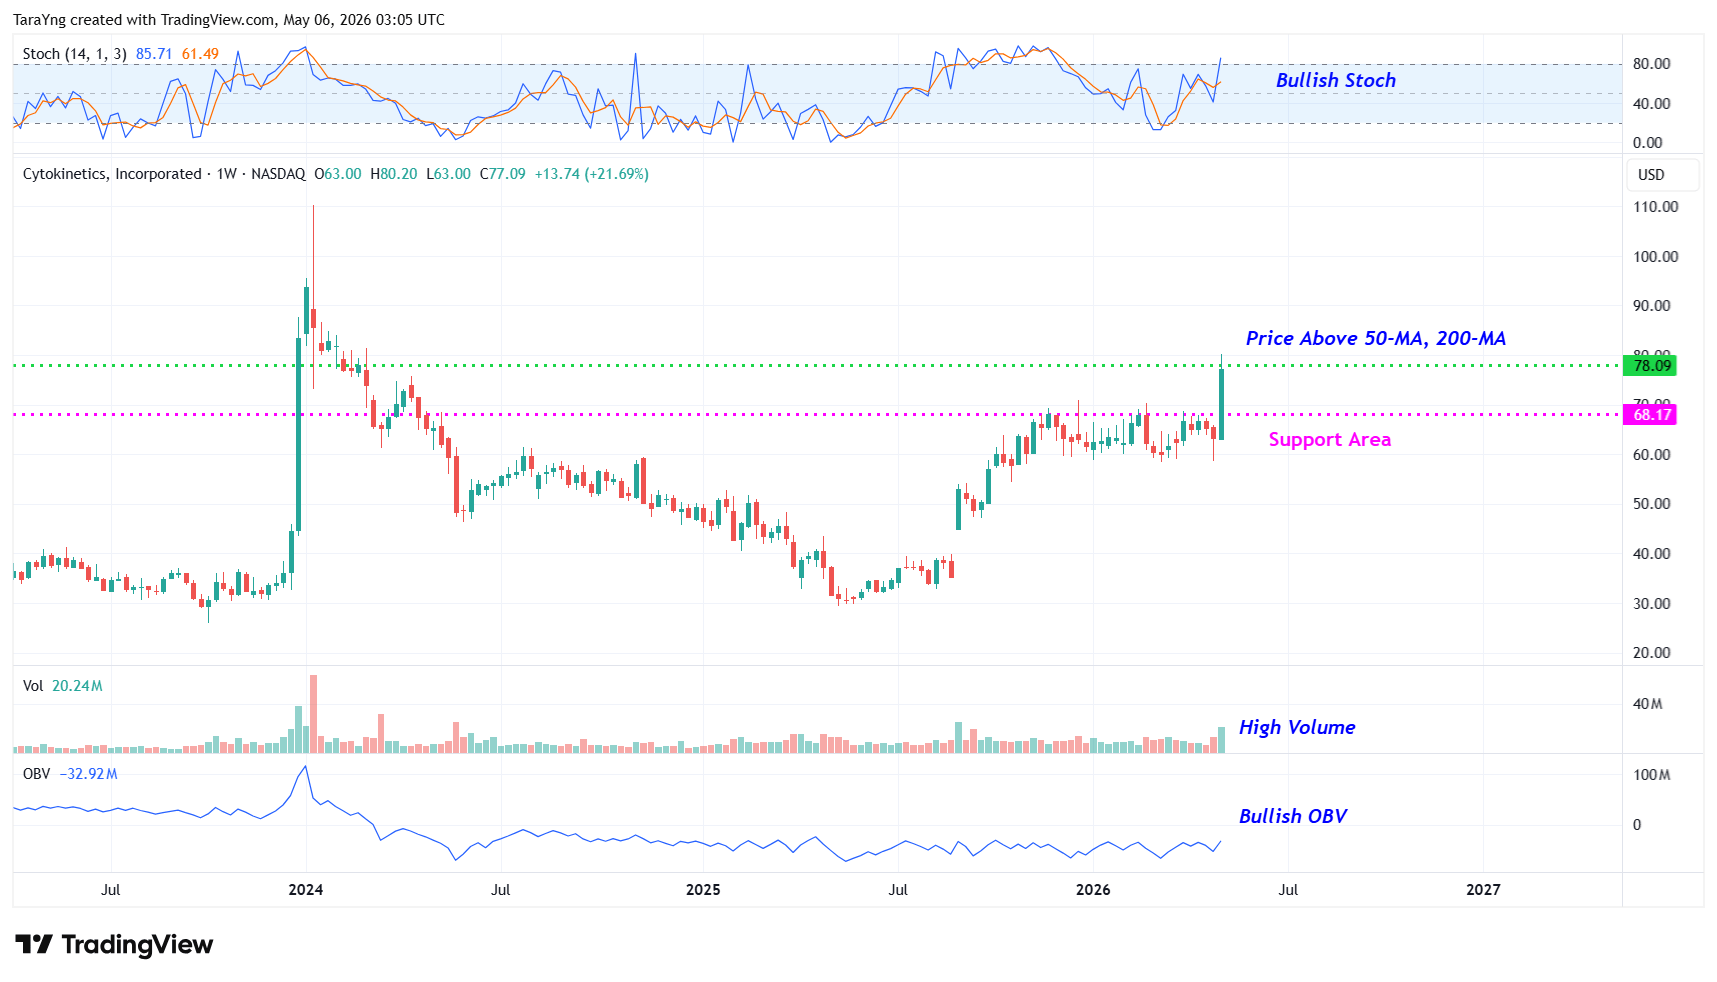
CYTK – Weekly Chart
#6 %K above %D: The %K line of stochastic has crossed above the %D line on the weekly chart and has also moved higher from oversold levels. A %K/%D bullish crossover at oversold levels suggests that selling pressure is exhausting and buyers are beginning to reassert control. Because this is occurring on the weekly chart rather than the daily, the signal carries greater weight and points to a potential longer-term trend shift in favor of the bulls.
#7 Positive OBV: The On-Balance Volume indicator on the weekly chart is trending higher, reflecting that volume in up weeks is consistently outpacing volume in down weeks. Rising OBV confirms that institutional money is accumulating the stock rather than distributing it. When price and OBV rise in tandem, it validates the breakout and suggests the move has genuine buying conviction behind it, rather than being a low-volume head fake.
Risks to Consider
Even strong setups can fail, especially in a late-stage biotech name like Cytokinetics. A few things could knock the stock off course:
- A breakdown back below the consolidation breakout level on heavy volume
- Negative company-specific news or broader market weakness that pressures biotech and specialty pharma names
- Dilution pressure from the recent $650 million public stock offering — while it strengthens the balance sheet, it also adds incremental shares that can weigh on near-term price action
- Insider selling, with notable recent sales by executives in April and early May, which can dampen sentiment even when tied to scheduled option exercises or 10b5-1 plans
- Direct competition from Bristol-Myers Squibb’s Camzyos (mavacamten) in obstructive HCM, plus emerging sarcomere modulator players like Edgewise Therapeutics
- Class effects inherent to cardiac myosin inhibitors, including LVEF monitoring requirements, REMS programs, and heart-failure risk that can affect adoption pace
- Continued unprofitability, with Q1 2026 net loss of $206 million and 2026 R&D + SG&A guidance of $830–$870M — execution has to stay on track for the cash runway thesis to hold
- Regulatory or label-related risk around the November 14 MAPLE-HCM PDUFA decision, where any delays or restrictions could limit near-term commercial expansion
The Bottom Line
CYTK is breaking out of a multi-month consolidation on the daily chart while bouncing cleanly off a resistance-turned-support level on the weekly — a dual-timeframe technical setup that historically signals the start of a sustained move higher.
The fundamental story underneath the chart is just as strong: a landmark Phase 3 win in a market competitors couldn’t crack, rapidly accelerating U.S. and European commercial launches, and a stock that hit a 52-week high on the same day as a $650 million dilution announcement — a rare tape signal that institutional money is buying into strength.
Combine that with multiple regulatory and commercial catalysts staggered through year-end, and CYTK looks like one of the more compelling risk-reward setups on the board right now.
If this is a trade you want to get in on, here’s how we’d play it. Below you’ll find our exact entry level, both price targets that imply 20%–36% potential upside, and the stop-loss we’re using to manage the downside.
Recommended Trade Setup
| Item | Detail |
|---|---|
| Buy Level | Above approximately $78.10 |
| Price Target 1 | $94.00 — Potential upside: 20% |
| Price Target 2 | $106.00 — Potential upside: 36% |
| Timeframe | Next 3–6 months |
| Stop-Loss | $69.00 on a closing basis |
If needed, swipe or scroll sideways to view the full table.
For a risk of approximately $9.10 per share, the target rewards are about $15.90 and $27.90 per share. That makes this roughly a 1:2 and 1:3 risk-reward trade. In other words, the setup offers nearly 2x to 3x more potential upside than downside.
Happy Trading!
Tara and Greg
Source: TradesOfTheDay.com
