
🚨 Trade Update: Nebius Group (NBIS)
We originally recommended NBIS on April 13, 2026. The stock has now hit our first price target, delivering a 17% return from our buy level.
Traders looking to reduce risk may consider trimming half their position here and trailing their stop just below PT1. Those with higher conviction may continue holding for PT2.
Bottom line: NBIS has done its job on the first leg. From here, it’s about managing the trade — book some profits, protect the rest, and stay disciplined.
We flagged Ardelyx, Inc. (NASDAQ: ARDX) in our watchlist this past Sunday — and the stock has since broken out powerfully and looks headed even higher.
As we’ll get to just ahead, the combination of a major Q1 earnings beat, a newly granted patent extending IP protection to 2042, and a fresh technical breakout makes ARDX one of the more interesting setups on the board. Here’s what’s going on…
The Themes Behind the Move
Ardelyx is a commercial-stage biotech focused on treatments for chronic kidney disease and gastrointestinal disorders.
In plain English, it sells two FDA-approved drugs — IBSRELA for irritable bowel syndrome with constipation (IBS-C) and XPHOZAH for elevated phosphorus in dialysis patients — which means its business is closely tied to prescription growth, payer reimbursement decisions, and how well its commercial team can keep scaling the IBSRELA ramp.
ARDX’s latest move doesn’t appear to be about one isolated headline. Instead, traders seem to be reacting to a broader set of developments that have meaningfully strengthened the story over the past few weeks.
| Theme / Catalyst | What Happened | Why Traders Care |
|---|---|---|
| Q1 2026 earnings beat | On April 30, Ardelyx reported Q1 product revenue of $93.4 million, up 38% year-over-year and ahead of consensus. IBSRELA was the standout, growing 58% YoY to $70.1 million. | A 58% jump in IBSRELA sales tells traders the drug is gaining real traction in the IBS-C market — turning ARDX’s story from “hopeful biotech” into “commercial machine that’s executing.” |
| Patent extension to 2042 | The U.S. Patent Office granted a new patent covering oral formulations of tenapanor — the active ingredient in both IBSRELA and XPHOZAH — extending IP protection through November 2042. | This significantly strengthens Ardelyx’s competitive moat and pushes generic risk out by more than a decade, dramatically lengthening the commercial runway for the company’s two flagship drugs. |
| Strategic refinancing & leadership additions | In April, ARDX refinanced its debt with SLR Investment Corp and brought on Rajani Dinavahi, M.D. as Chief Medical Officer and Felecia W. Ettenberg, Esq. as Chief Legal Officer. | Refinancing extends the cash runway, while the new CLO is a tactical move to handle ongoing CMS/Medicare reimbursement proceedings — a key swing factor for XPHOZAH’s long-term trajectory. |
| Sector tailwinds | The 2026 biotech tape is rewarding companies that can prove commercial viability rather than just clinical potential. As payers shift toward value-based care, Ardelyx’s first-in-class NHE3 inhibitors are increasingly being positioned as essential therapies for the “silent epidemic” of CKD and GI disorders. | This sector backdrop helps lift names that are already executing — and ARDX, with its 38% revenue growth and rapidly scaling lead drug, fits that profile better than most small-cap biotechs. |
| Solid fundamentals backing the story | 2025 full-year IBSRELA revenue came in at roughly $274 million, and 2026 guidance points to total product revenue of about $550 million at the high end. The company holds a $238 million cash position with the net loss narrowing year-over-year. | Numbers like these turn the story from purely thematic into something more concrete. A clean balance sheet plus a clear path to scale gives traders a fundamental floor to lean on while the catalysts play out. |
| Analyst coverage leaning very bullish | Among the 10 analysts covering ARDX, the average 12-month price target sits at $15.70, with a high of $19.00 and a low of $10.00. Against the recent price of $7.30, that implies roughly 115% upside to the mean. | When the entire analyst range sits above the current price — and the average implies more than a double — it signals that Wall Street sees the recent execution as meaningfully under-reflected in the stock. |
| Upcoming triggers | Traders are watching NKF Spring Clinical Meetings (May 6–10) for tenapanor poster data, Digestive Disease Week wrapping today, Q2 earnings on August 4, and the RDX10531 IND filing in H2 2026. | Multiple near-term catalysts give the stock a steady drumbeat of potential upside drivers — and positive clinician feedback at NKF or DDW is exactly the kind of “smart money” trigger that has historically moved small-cap biotech names. |
If needed, swipe or scroll sideways to view the full table.
Put it all together, and ARDX is looking less like a speculative small-cap biotech and more like a commercially executing specialty pharma name with extended IP protection, accelerating revenue, and real near-term catalysts behind it.
The story may be getting stronger, but the chart is what could determine whether this move has more room to run in the near term. Here are the bullish technical signals traders should be watching now.
Bullish Technical Signals
#1 Symmetrical Triangle Pattern Breakout: ARDX has broken out of a symmetrical triangle on the daily chart. This is a pattern formed by converging trendlines as price prints lower highs and higher lows, reflecting a tightening tug-of-war between buyers and sellers. This compression of volatility typically resolves with a decisive move in the direction of the prior trend. The recent breakout, accompanied by a pickup in volume, confirms bullish resolution and signals that the consolidation phase is over.
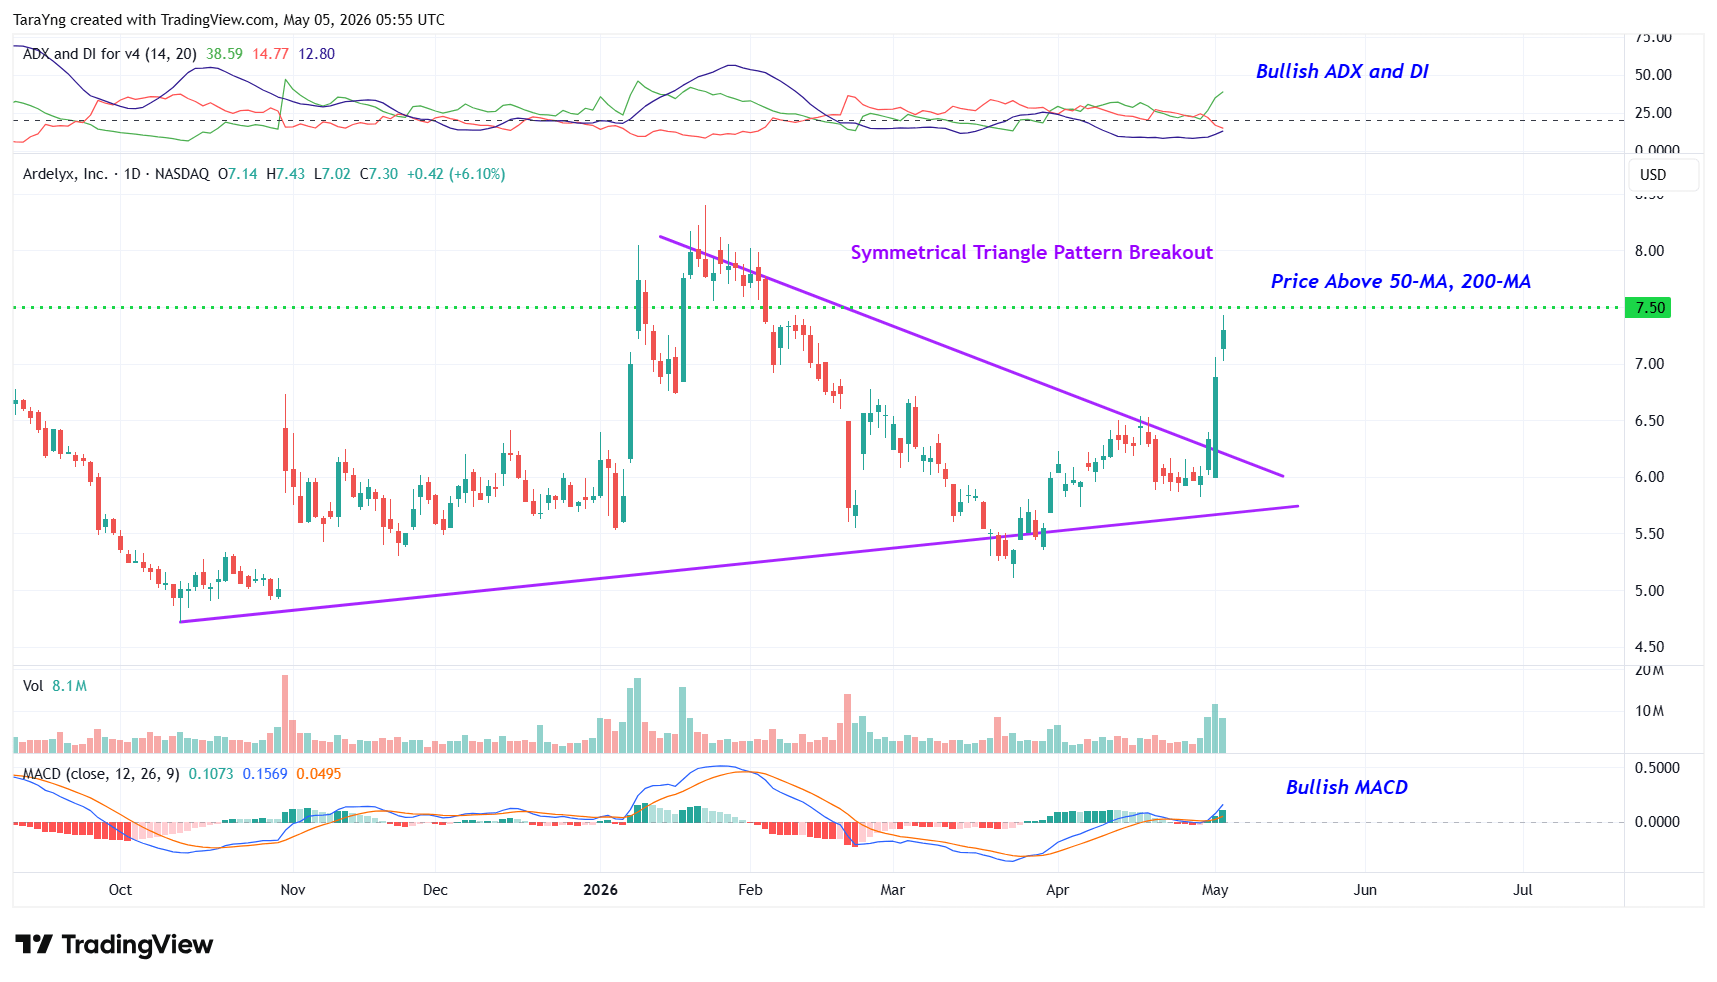
ARDX – Daily Chart
#2 Price above MAs: Price is trading above both the 50-day and 200-day SMAs. This indicates that bulls hold structural control across both the short and longer-term timeframes. Beyond signaling trend direction, these moving averages now serve as dynamic support levels, meaning pullbacks toward them are likely to attract buyers rather than accelerate selling.
#3 MACD Above Signal Line: On the daily chart, the MACD line has crossed above the signal line. This is a bullish crossover indicating that short-term momentum is now outpacing longer-term momentum. This shift in the histogram reflects accelerating buying pressure and historically acts as an early-stage buy signal.
#4 Bullish ADX: The daily chart’s ADX setup is constructive on two fronts: the +DI line is running above the –DI line, confirming that buyers are dictating trend direction, while the ADX line itself is rising from below both DI lines. This is a signal that a new trend is not only forming but gaining momentum rapidly. Since ADX measures trend strength regardless of direction, this upturn from a low base is particularly significant, as it suggests the move is in its early stages with room to build.
#5 Cup and Handle Pattern Breakout: On the weekly chart, ARDX has broken out of a cup and handle, which is one of the most reliable long-term bullish continuation patterns in technical analysis. The rounded “U”-shaped base (cup) reflects an orderly absorption of selling pressure, while the subsequent shallow drift lower (handle) acts as a final shakeout before the move higher. The breakout above handle resistance on elevated volume confirms potential institutional participation and signals the potential for a sustained, multi-week advance.
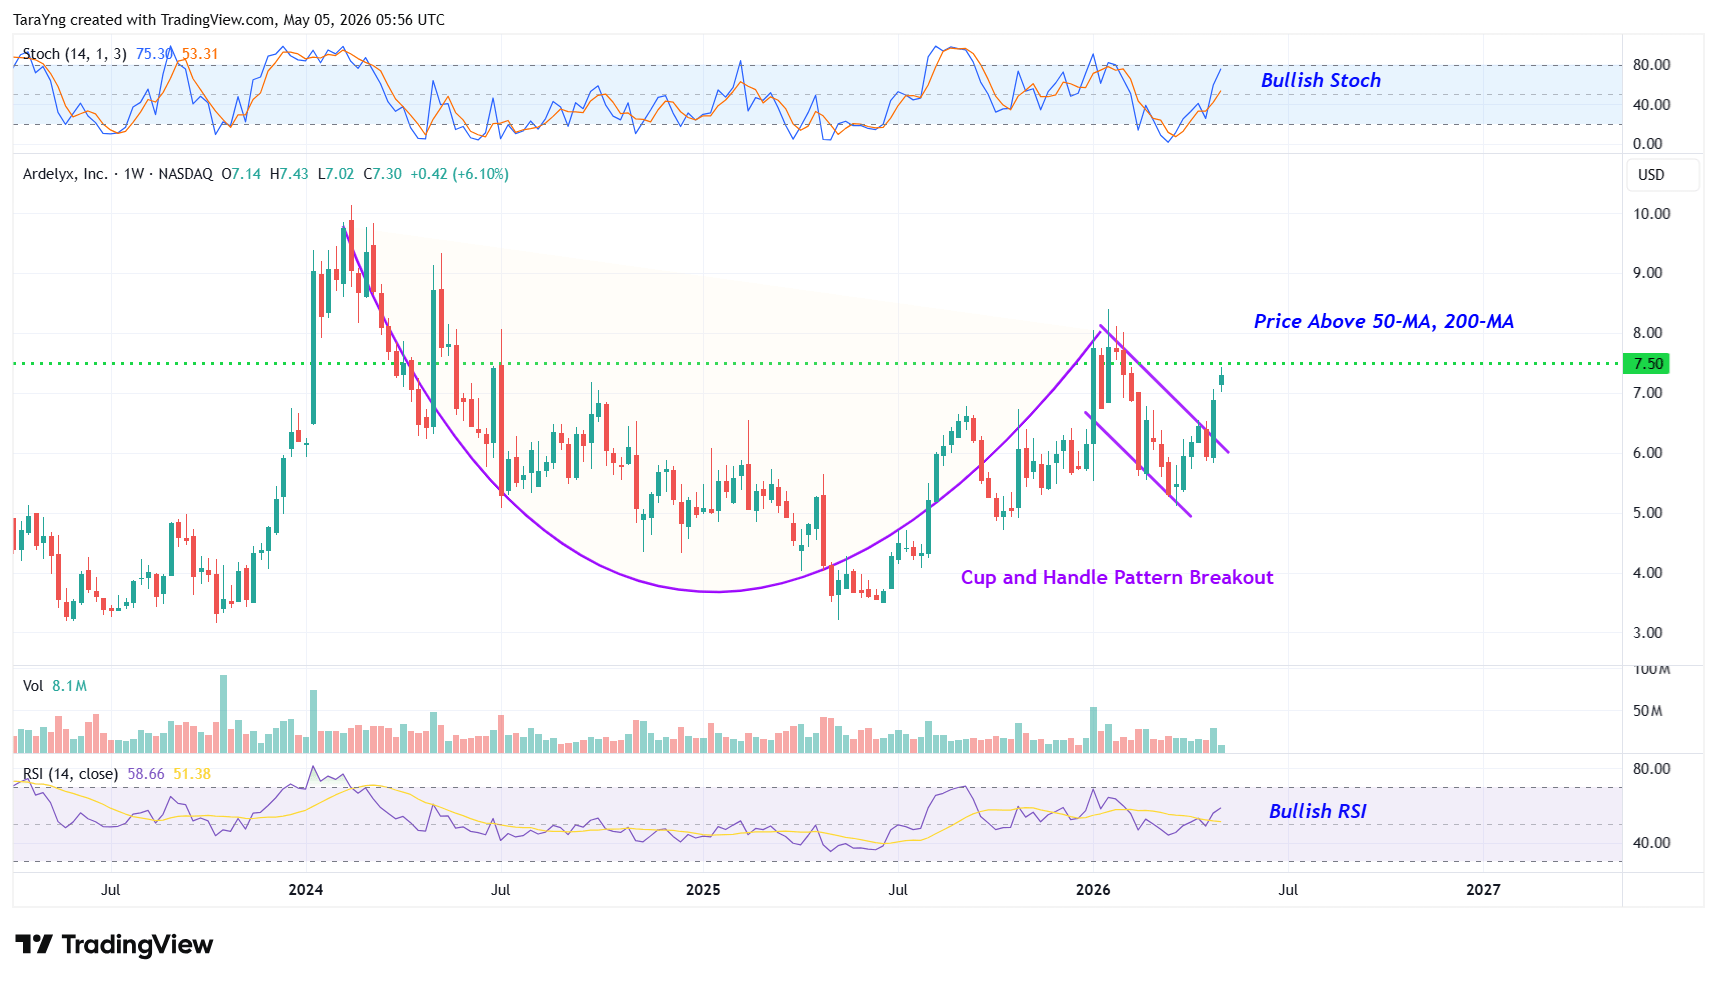
ARDX – Weekly Chart
#6 %K above %D: On the weekly chart, the %K line has crossed above the %D line while emerging from oversold territory, which is a high-conviction combination. A crossover from an oversold base signals that selling pressure is exhausting and buyers are stepping in with conviction. On a weekly timeframe, this carries added weight, pointing to a potential longer-term shift in momentum in favor of the bulls.
#7 Bullish RSI: The weekly RSI is above the 50 midline and trending higher. Crossing and holding above 50 confirms that buying momentum structurally outweighs selling pressure. The continued upward trajectory rules out a stalling signal, instead indicating that momentum is building rather than plateauing, which is consistent with the early stages of a durable uptrend.
Risks to Consider
Even strong setups can fail, especially in a small-cap biotech name like Ardelyx. A few things could knock the stock off course:
- A breakdown back below the symmetrical triangle pattern on heavy volume
- Negative company-specific news or broader market weakness that pressures small-cap biotech and specialty pharma names
- High cash burn, with Q1 SG&A expenses hitting $102.3 million — a level that, while typical for a biotech in commercial scale-up mode, leaves less room for error if revenue growth slows
- Reimbursement risk, since potential CMS changes to Medicare Part D coverage for phosphate binders could weigh on XPHOZAH demand
- Insider selling of roughly $1.0 million over the past three months, which can dampen sentiment even when sales are tied to scheduled 10b5-1 plans
- Continued unprofitability, since the company is still operating at a net loss even as that loss narrows and management points to a clearer path forward
- Competitive pressure in the IBS-C market from established players like Linzess, and from traditional phosphate binders on the XPHOZAH side
- Regulatory or policy changes affecting the broader specialty pharma or kidney-disease therapeutics space
The Bottom Line
ARDX is breaking out of a symmetrical triangle on the daily chart and a cup-and-handle on the weekly — a dual-timeframe technical setup that historically signals the start of a sustained move higher. And the fundamental story underneath the chart only strengthens the case: IBSRELA’s 58% YoY growth confirms commercial execution is working, the $238 million cash position gives the company room to operate without near-term dilution, and the new patent extending IP protection through 2042 locks in the long-term franchise. Combine that with multiple near-term catalysts on the calendar and analyst targets implying more than 115% upside from current levels, and ARDX looks like one of the more compelling risk-reward setups on the board right now.
If this is a trade you want to get in on, here’s how we’d play it. Below you’ll find our exact entry level, both price targets that imply 16%–29% potential upside, and the stop-loss we’re using to manage the downside.
Recommended Trade Setup
| Item | Detail |
|---|---|
| Buy Level | Above $7.50 |
| Price Target 1 | $8.70 — Potential upside: 16% |
| Price Target 2 | $9.70 — Potential upside: 29% |
| Timeframe | Next 3–6 months |
| Stop-Loss | $6.80 on a closing basis |
If needed, swipe or scroll sideways to view the full table.
For a risk of approximately $0.70 per share, the target rewards are about $1.20 and $2.20 per share. That makes this roughly a 1:2 and 1:3 risk-reward trade. In other words, the setup offers nearly 2x to 3x more potential upside than downside.
Happy Trading!
Tara and Greg
Source: TradesOfTheDay.com
