Applied Optoelectronics, Inc. (NASDAQ: AAOI) seems poised for a price surge based on its latest charts. The company designs, manufactures, and sells fiber-optic networking products in the United States, Taiwan, and China. It offers optical modules, optical filters, lasers, laser components, subassemblies, transmitters and transceivers, turn-key equipment, headend, node, and distribution equipment, as well as amplifiers.
Bullish Indications
#1 Symmetrical Triangle Pattern: The daily chart shows that the stock has recently formed a Symmetrical Triangle pattern. This is a continuation pattern and is characterized by two converging trend lines connecting a series of sequential peaks and troughs. This pattern is marked on the daily chart as purple lines. The breakout from a symmetrical triangle pattern usually signifies a bullish move. Currently, the stock looks poised for a breakout from the symmetrical triangle pattern.
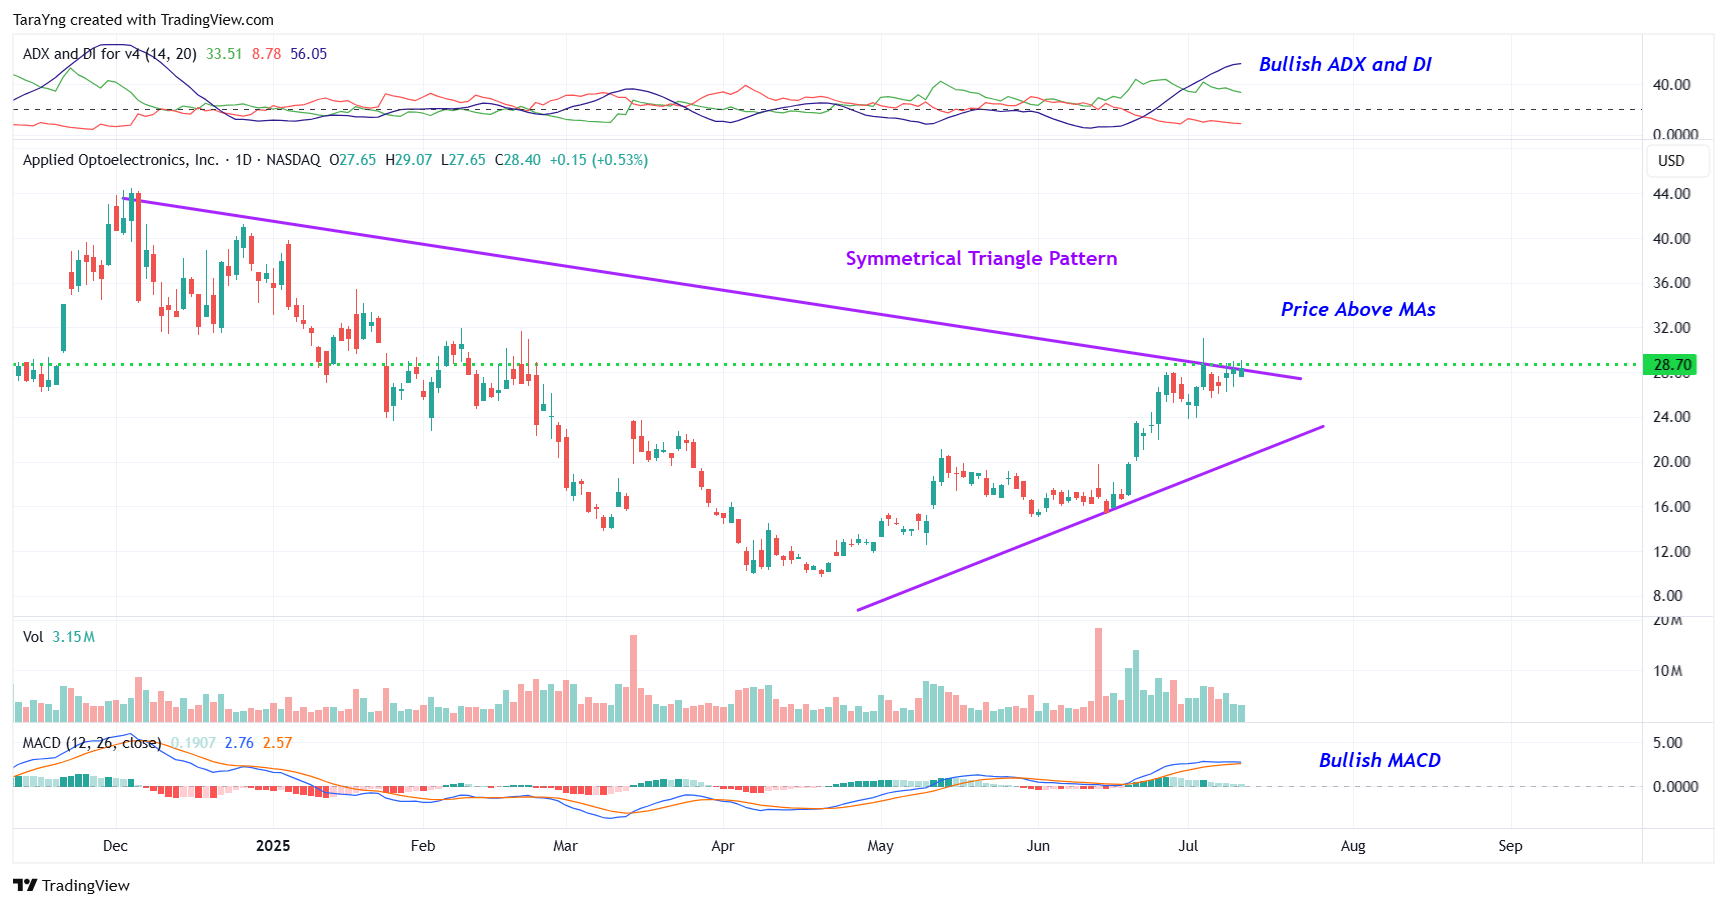
AAOI – Daily Chart
#2 Price above MAs: The price is currently above the short-term moving average of 50-day SMA as well as the longer-term moving average of 200-day SMA, indicating that the bulls are still in control. This is a positive indication.
#3 MACD Above Signal Line: In the daily chart, the MACD line (light blue color) is currently above the MACD signal line (orange color) which is typically considered bullish.
#4 Bullish ADX: The ADX indicator shows that the +DI line is currently above the –DI line and the ADX line has started to move up from below the –DI and +DI lines. This indicates possible bullishness.
#5 Above Support Area: As you can see from the weekly chart, the stock has currently moved up from a resistance-turned-support level. This level is marked as a pink dotted line. This looks like a good area for the stock to move higher. The stock is also trading above its 50-week and 200-week SMA, indicating that the bulls are still in control.
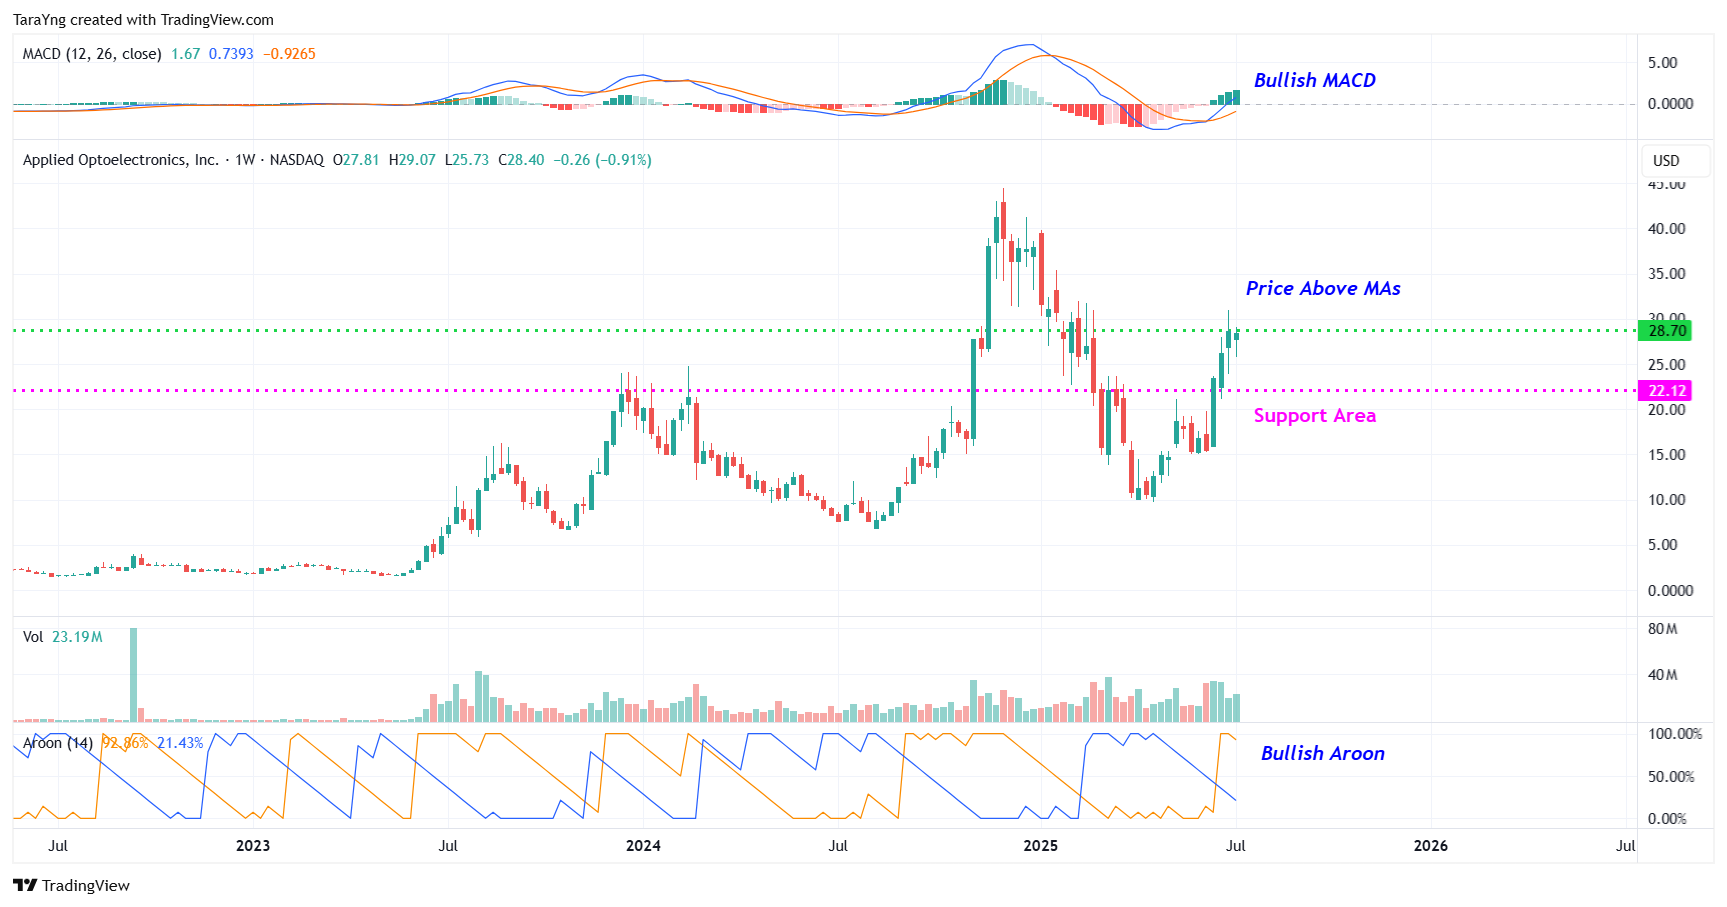
AAOI – Weekly Chart
#6 Bullish MACD: The MACD line is above the MACD signal line in the weekly chart as well, indicating bullishness.
#7 Bullish Aroon: The value of Aroon Up (orange line) is above 70 while Aroon Down (blue line) is below 30 in the weekly chart. This indicates possible bullishness.
Recommended Trade (based on the charts)
Buy Levels: If you want to get in on this trade, you can purchase shares of AAOI above the price of around $28.70.
TP: Our target prices are $33.00 and $36.00 in the next 3-6 months.
SL: To limit risk, place stop-loss at $26.40. Note that the stop-loss is on a closing basis.
Our target potential upside is 15% to 25% in the next 3 to 6 months.
For a risk of $2.30, our target rewards are $4.30 and $7.30. This is a nearly 1:2 and 1:3 risk-reward trade.
In other words, this trade offers nearly 2x to 3x more potential upside than downside.
Risks to Consider
The stock may reverse its overall trend if it breaks down from the symmetrical triangle pattern with a high volume. The sell-off of the stock could also be triggered in case of any negative news, overall weakness in the market, or any regulatory changes in the sector.
Happy Trading!
Tara
The old way of investing in tech giants is over. A NEW strategy unlocks 146X more income on the SAME underlying stocks (like Meta, Apple, and Amazon) -- WITHOUT options trading. Click here to uncover the NEW MAG-7 alternative.
Source: Trades of the Day

