Picking a winning trade on a consistent basis is not simply a stroke of luck. It’s the result of calculated screening, planning, and deliberation.
With this in mind, we have started a new weekly series on our top 10 stocks to watch this week — stocks that look poised for a possible breakout in the coming days. Traders should add these stocks to their watchlist now.
The Top 10 Stocks to Watch This Week for Possible Breakouts
| Sl # | Name of the Stock | Stock Ticker | Last Close | Buy Level(s) | Reason |
| 1 | UroGen Pharma Ltd | NASDAQ: URGN | $12.03 | $12.30 | Downtrend Channel Breakout |
| 2 | Lockheed Martin Corp | NYSE: LMT | $486.45 | $498.00 | Consolidation Area |
| 3 | Frontline Plc | NYSE: FRO | $19.74 | $19.80 | Symmetrical Triangle Pattern Breakout |
| 4 | Houston American Energy Corp | AMEX: HUSA | $15.65 | $16.20 | Falling Wedge Pattern Breakout |
| 5 | RTX Corp | NYSE: RTX | $145.69 | $146.00 | Uptrend Channel Breakout |
| 6 | Neonode Inc. | NASDAQ: NEON | $16.81 | $17.00 | Breakout From Consolidation Area |
| 7 | Shell Plc ADR | NYSE: SHEL | $72.54 | $73.40 | Symmetrical Triangle Pattern Breakout |
| 8 | Bloom Energy Corp | NYSE: BE | $21.95 | $22.60 | Downtrend Channel |
| 9 | Super Micro Computer Inc. | NASDAQ: SMCI | $41.56 | $44.40 | Symmetrical Triangle Pattern |
| 10 | Viasat, Inc. | NASDAQ: VSAT | $12.60 | $12.80 | Breakout From Consolidation Area |
Important: Typically, these trades offer a risk: reward ratio of 1:2 or 1:3 in the next 6 months, which implies 2x to 3x rewards when compared to risks. So, be sure to set your stop-loss levels and target prices accordingly to manage your risk. In addition, these trade ideas are triggered using daily closing prices, not intra-day pricing. So, if you participate in these trades, make sure that you only buy the stock once its daily close is above the recommended price level.
That said, here are the top 10 stocks to watch for a breakout, in no particular order.
#1 UroGen Pharma Ltd (NASDAQ: URGN)
Sector: Healthcare • Biotechnology
Reason: Downtrend Channel Breakout
A downtrend or descending channel is the price action contained between downward sloping parallel lines. It is formed by two lines that are drawn by connecting the lower highs and lower lows of a stock’s price. Even though this is typically a bearish pattern, a breakout from the upper rail of this pattern is considered a good bullish indication.
Buy Level(s): The daily chart shows that the stock has currently broken out of a downtrend channel. However, there is a near-term resistance level for the stock. Hence, the ideal buy level for URGN is if the stock has a daily close above $12.30. This is marked in the chart below as a green color dotted line.
Daily chart – URGN
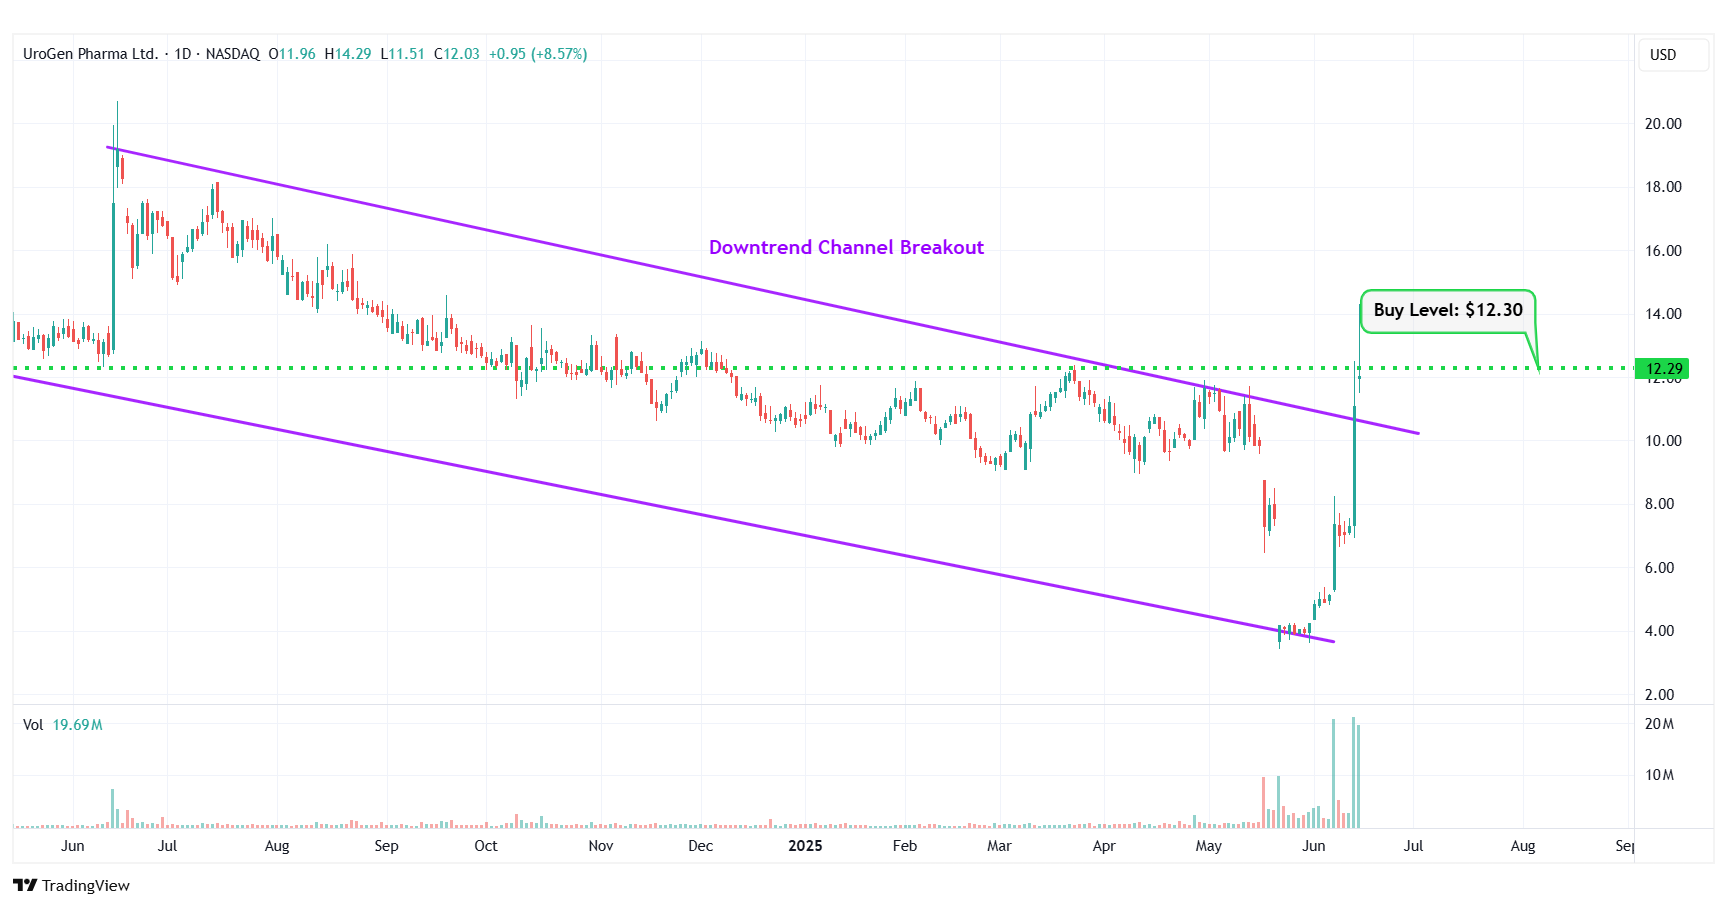
URGN – Downtrend Channel Breakout
#2 Lockheed Martin Corp (NYSE: LMT)
Sector: Industrials • Aerospace & Defense
Reason: Formation of a Consolidation Area in the Daily Chart
A Consolidation Area is a price action contained between two parallel lines. It is formed by a lower line that connects the lows, and an upper line that joins the highs. A stock usually trades between the two lines of the consolidation area before finally breaking out from the upper rail.
Buy Level(s): The ideal buy level for LMT is above the breakout level of the consolidation area, at around $498.00. This is marked in the chart below as a green color dotted line.
Daily chart – LMT
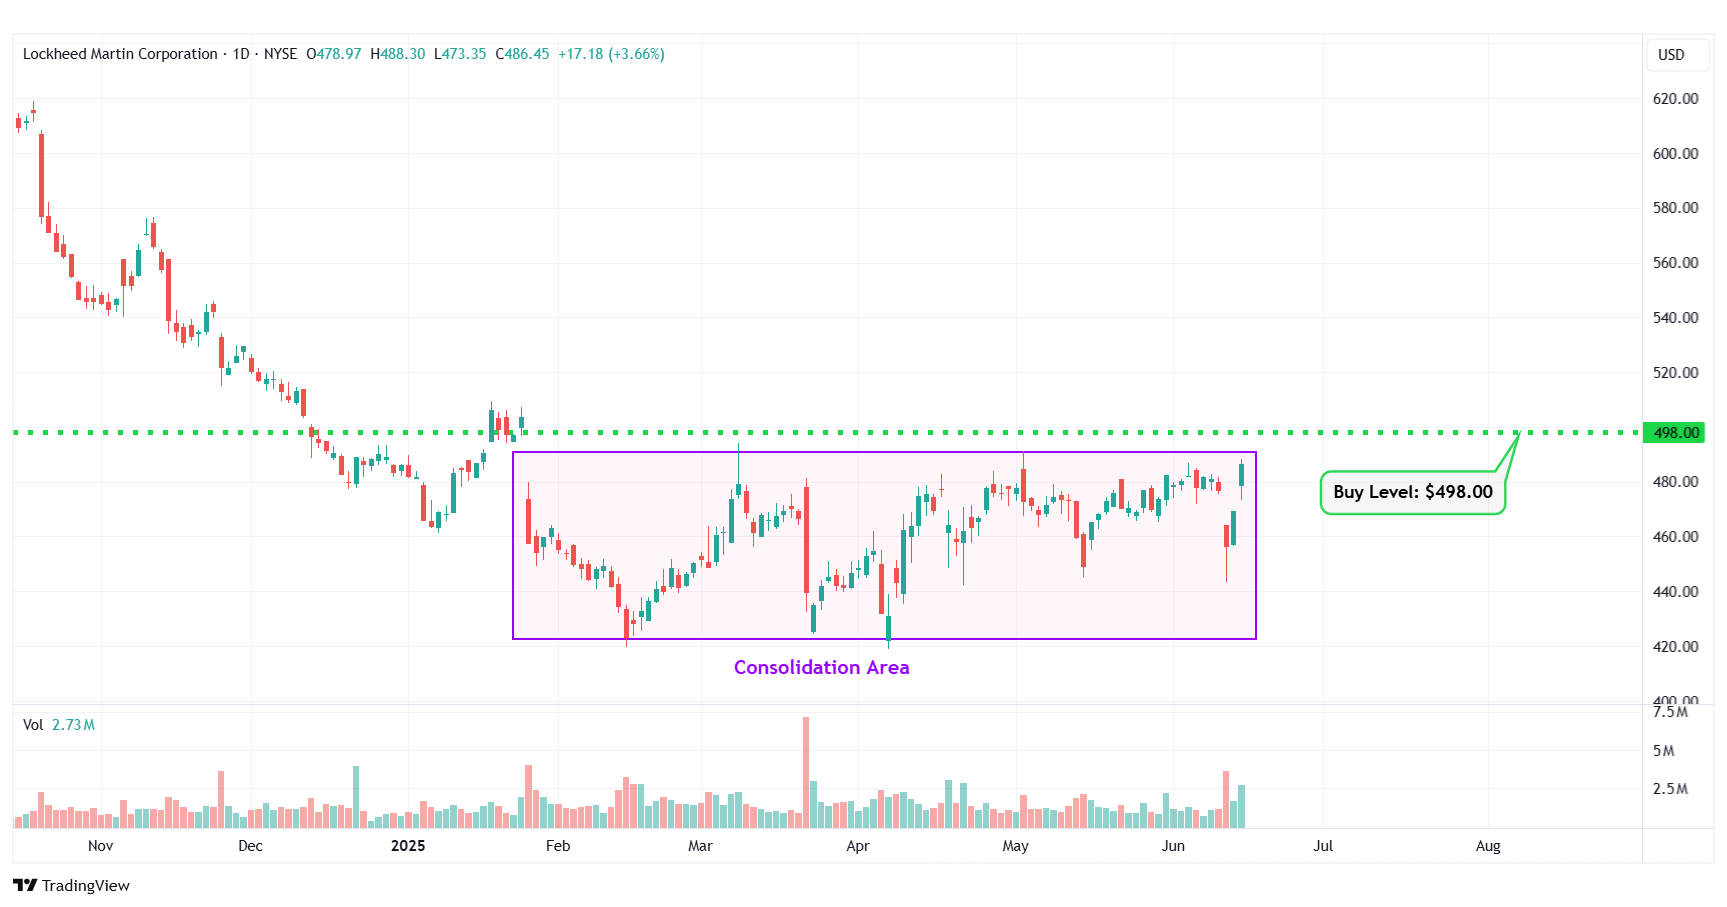
LMT – Consolidation Area
#3 Frontline Plc (NYSE: FRO)
Sector: Energy • Oil & Gas Midstream
Reason: Symmetrical Triangle Pattern Breakout
A symmetrical triangle is a chart pattern formed by two converging trend lines connecting a series of sequential peaks and troughs. These two lines result in the formation of a triangle that appears to be symmetrical.
A symmetrical triangle pattern is usually formed when there is indecision in the price movements and there is uncertainty among the buyers and sellers. This chart pattern represents a period of consolidation before the price breaks out or breaks down. In case a breakout occurs from the upper trend line, it is a strong bullish indication as it signifies the start of a new bullish trend.
Buy Level(s): The stock has currently broken out of a symmetrical triangle pattern. However, the ideal buy level for FRO is if the stock closes above the immediate resistance level of $19.80. This is marked in the chart below as a green color dotted line.
Daily chart – FRO
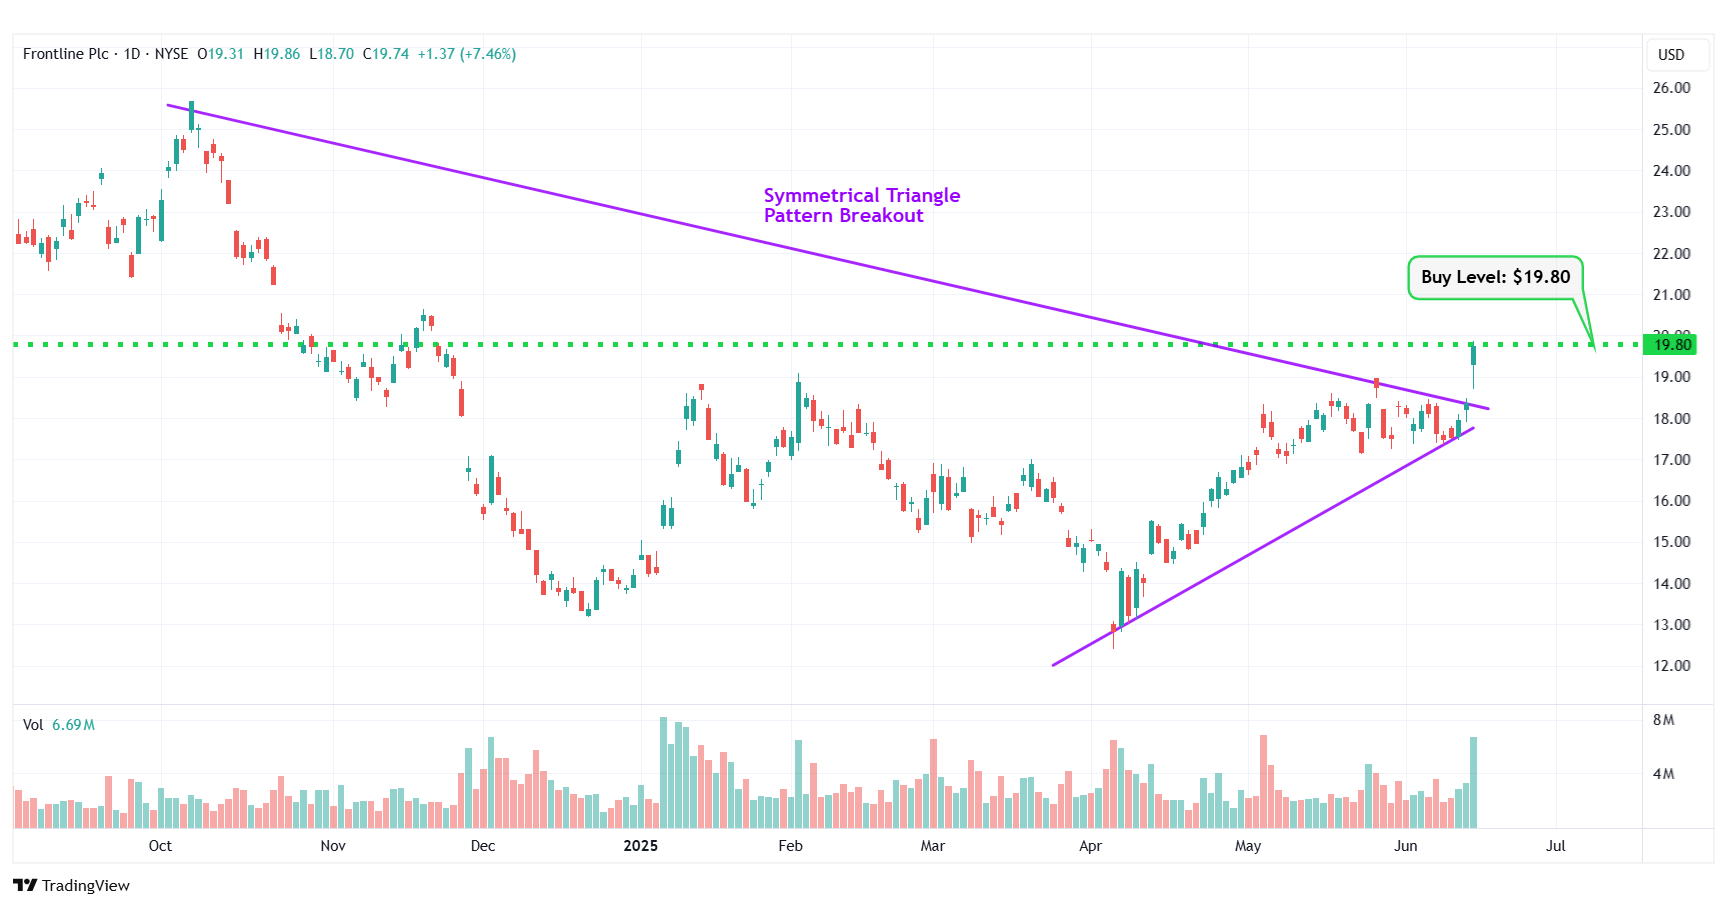
FRO – Symmetrical Triangle Pattern Breakout
#4 Houston American Energy Corp (AMEX: HUSA)
Sector: Energy • Oil & Gas E&P
Reason: Falling Wedge Pattern Breakout
A falling wedge pattern is formed by joining two downward-sloping, converging trendlines having a contracting range. The pattern appears to be wide at the top and continues to contract as prices fall. A breakout from a falling wedge pattern can indicate either reversal or continuation depending on where the pattern appeared in the trend.
A stock that has broken out of a falling wedge pattern would have gained momentum and would have the potential to move higher.
Buy Level(s): The stock has currently broken out of a falling wedge pattern. However, the ideal buy level for HUSA is above the nearest resistance level of $16.20. This is marked in the chart below as a green color dotted line.
Daily chart – HUSA
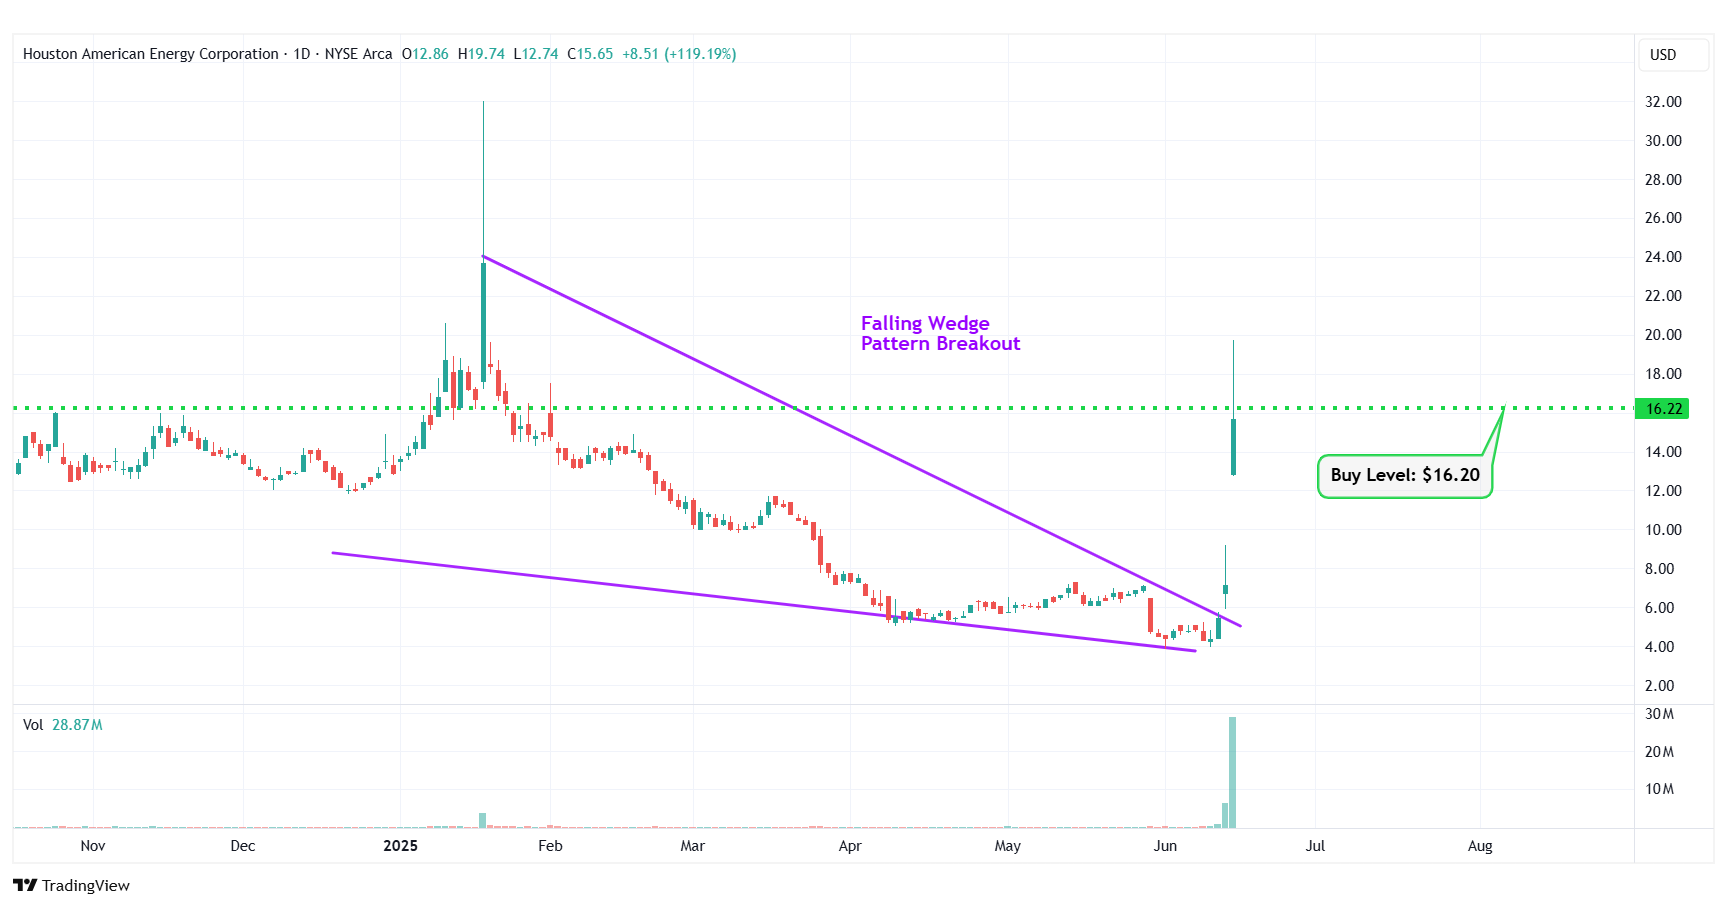
HUSA – Falling Wedge Pattern Breakout
#5 RTX Corp (NYSE: RTX)
Sector: Industrials • Aerospace & Defense
Reason: Breakout From an Uptrend Channel
An uptrend channel or an ascending channel is the price action contained between upward sloping parallel lines. It is formed by a lower trend line that connects the swing lows, and an upper channel line that joins the swing highs. A stock usually trades between the two rails of the uptrend channel before finally breaking out from the upper rail.
Buy Level(s): The stock has currently broken out of the uptrend channel. However, the ideal buy level for RTX is if the stock has a daily close above the near-term resistance level of $146.00. This is marked in the chart below as a green color dotted line.
Daily chart – RTX
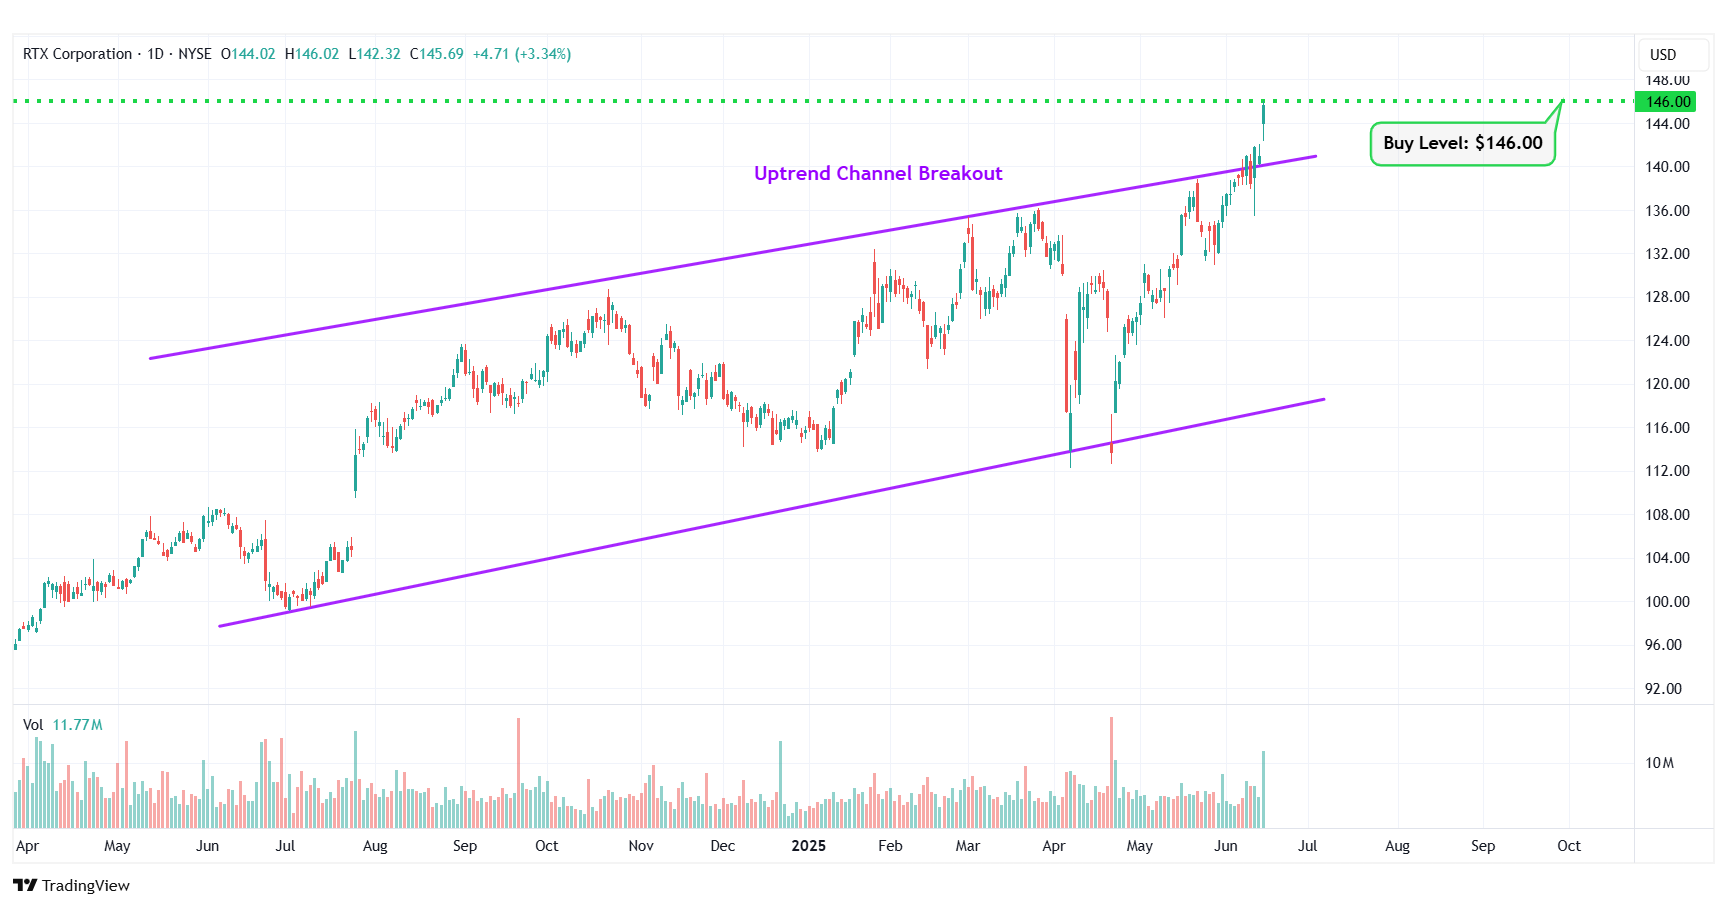
RTX – Uptrend Channel Breakout
#6 Neonode Inc. (NASDAQ: NEON)
Sector: Technology • Electronic Components
Reason: Breakout From a Consolidation Area in the Daily Chart
A Consolidation Area is a price action contained between two parallel lines. It is formed by a lower line that connects the lows, and an upper line that joins the highs. A stock usually trades between the two lines of the consolidation area before finally breaking out from the upper rail.
Buy Level(s): Although the stock has currently broken out of a consolidation area, the ideal buy level for NEON is above the near-term resistance area, which translates to a price of around $17.00. This is marked in the chart below as a green color dotted line.
Daily chart – NEON
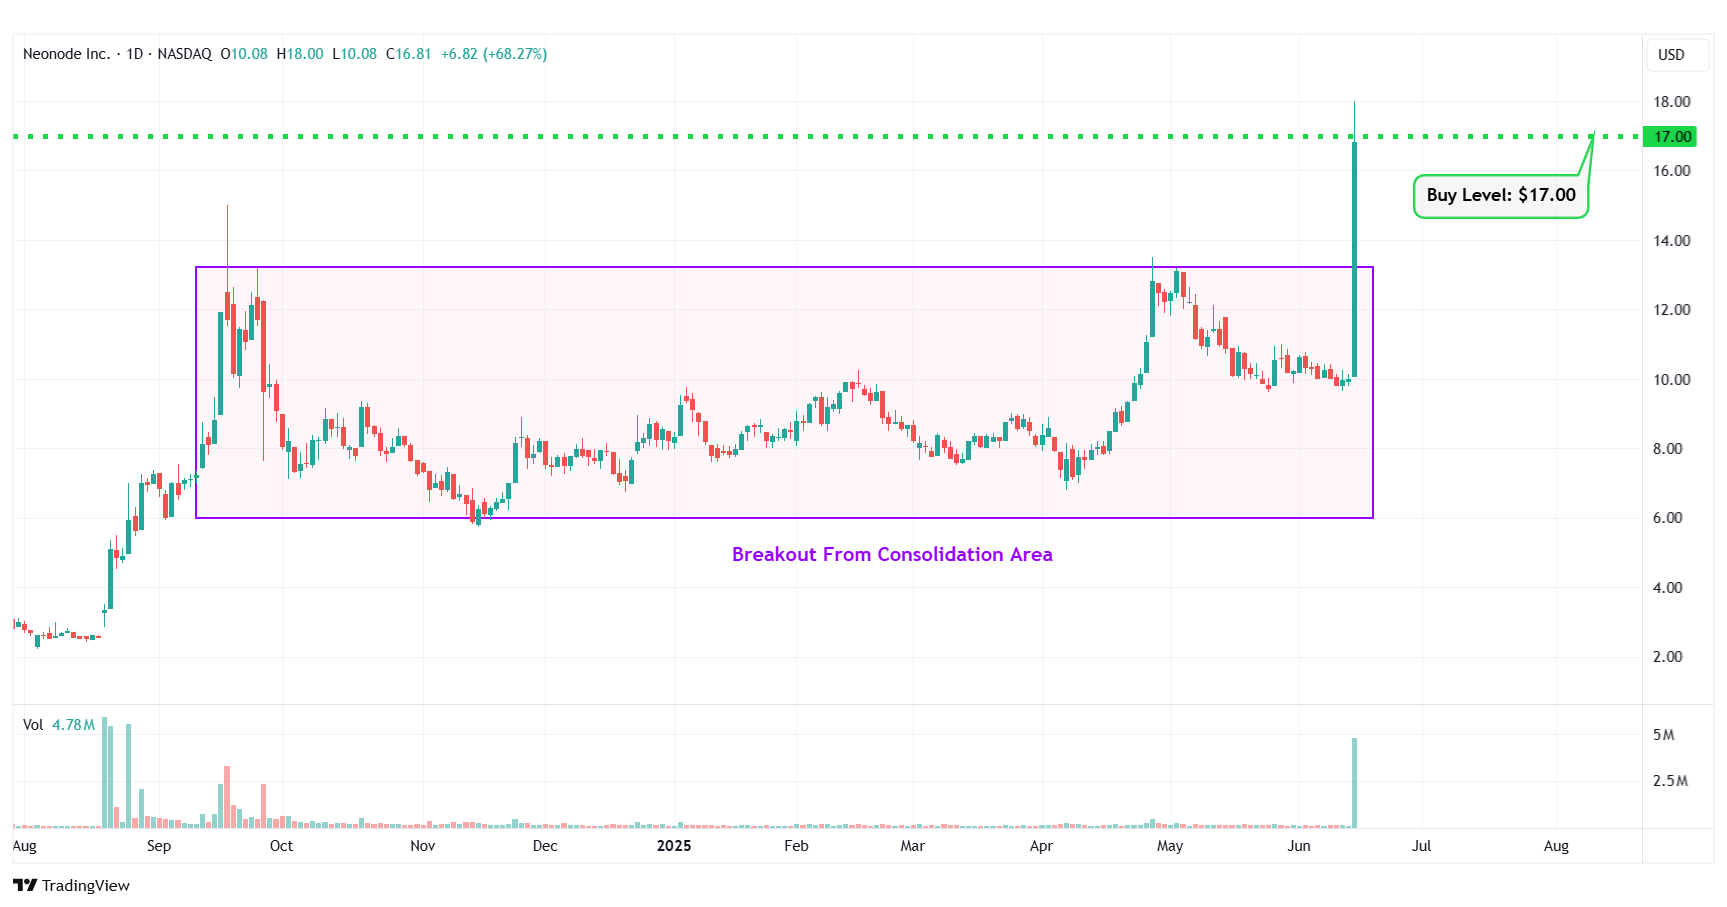
NEON – Breakout From Consolidation Area
#7 Shell Plc ADR (NYSE: SHEL)
Sector: Energy • Oil & Gas Integrated
Reason: Symmetrical Triangle Pattern Breakout
A symmetrical triangle is a chart pattern formed by two converging trend lines connecting a series of sequential peaks and troughs. These two lines result in the formation of a triangle that appears to be symmetrical.
A symmetrical triangle pattern is usually formed when there is indecision in the price movements and there is uncertainty among the buyers and sellers. This chart pattern represents a period of consolidation before the price breaks out or breaks down. In case a breakout occurs from the upper trend line, it is a strong bullish indication as it signifies the start of a new bullish trend.
Buy Level(s): The stock has currently broken out of a symmetrical triangle pattern. However, the ideal buy level for SHEL is if the stock closes above the immediate resistance level of $73.40. This is marked in the chart below as a green color dotted line.
Daily chart – SHEL
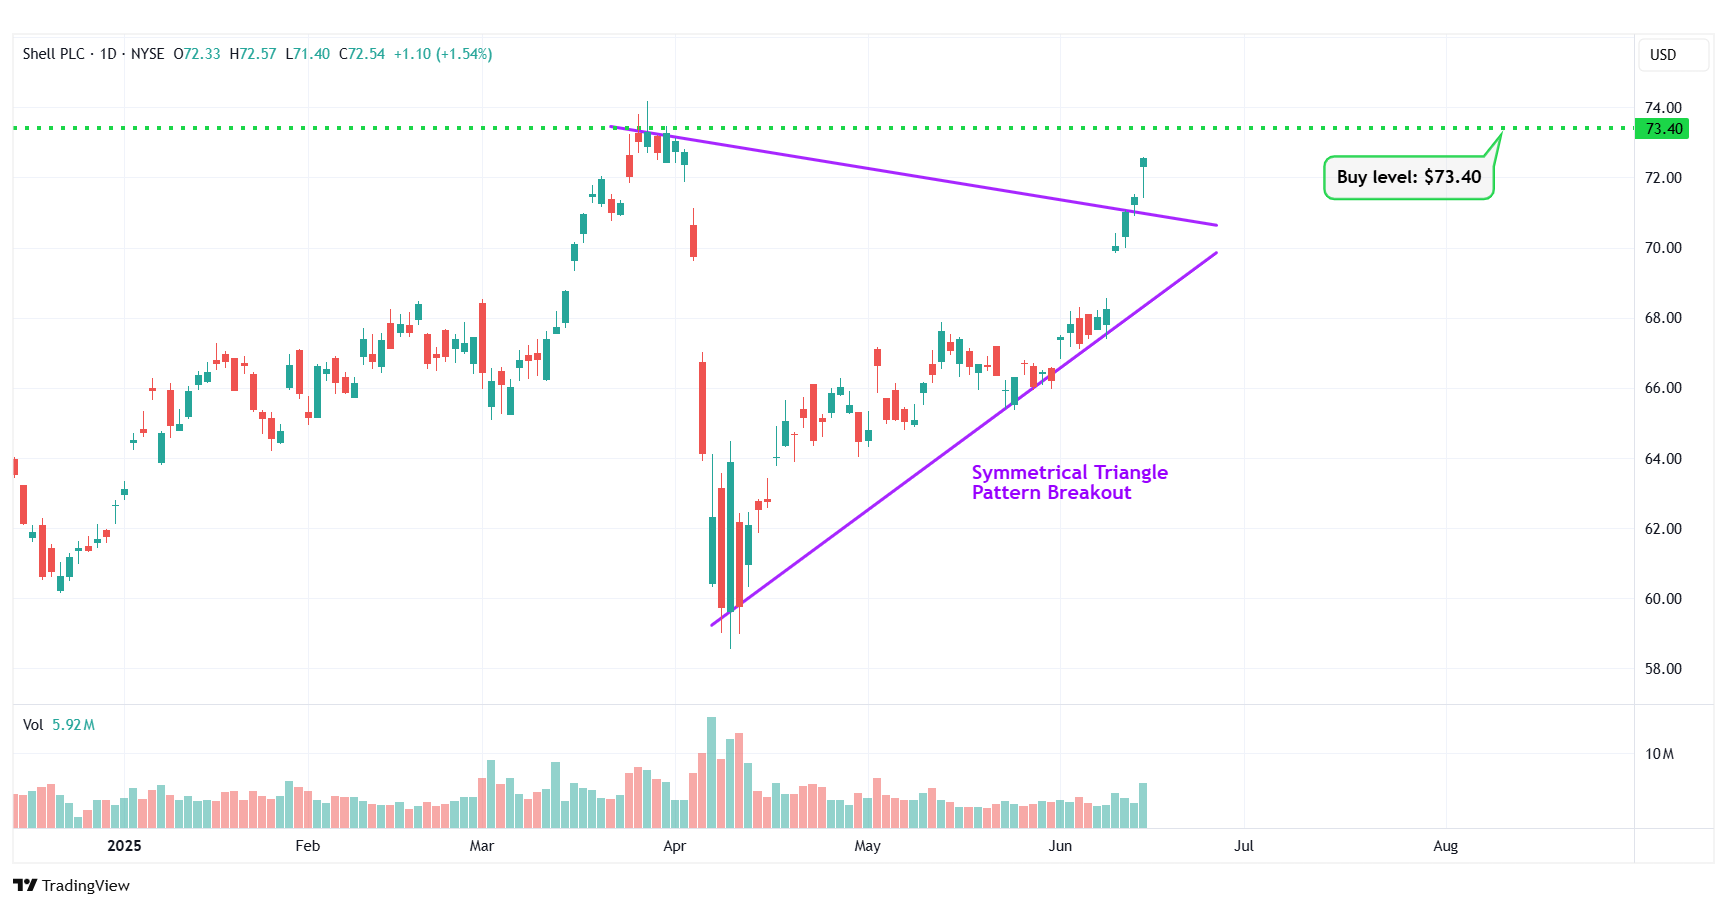
SHEL – Symmetrical Triangle Pattern Breakout
#8 Bloom Energy Corp (NYSE: BE)
Sector: Industrials • Electrical Equipment & Parts
Reason: Formation of a Downtrend Channel
A downtrend or descending channel is the price action contained between downward sloping parallel lines. It is formed by two lines that are drawn by connecting the lower highs and lower lows of a stock’s price. Even though this is typically a bearish pattern, a breakout from the upper rail of this pattern is considered a good bullish indication.
Buy Level(s): The daily chart shows that the stock is currently forming a downtrend channel. The ideal buy level for BE is if the stock breaks out of the downtrend channel and has a daily close above $22.60. This is marked in the chart below as a green color dotted line.
Daily chart – BE
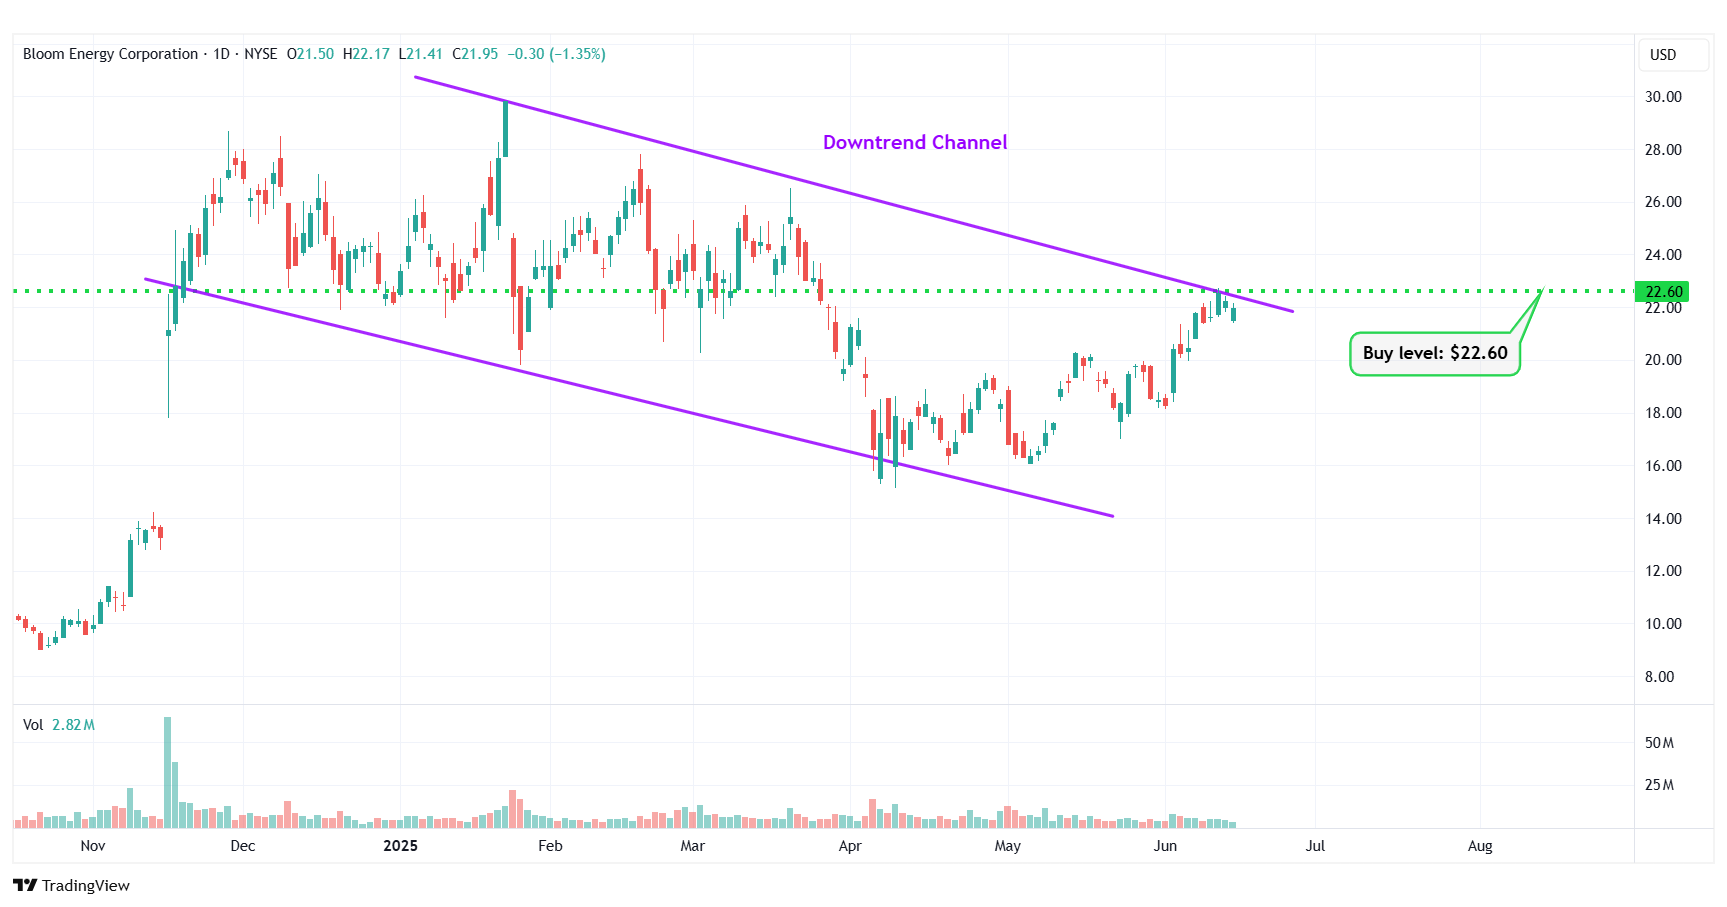
BE – Downtrend Channel
#9 Super Micro Computer Inc. (NASDAQ: SMCI)
Sector: Technology • Computer Hardware
Reason: Formation of a Symmetrical Triangle Pattern
A symmetrical triangle is a chart pattern formed by two converging trend lines connecting a series of sequential peaks and troughs. These two lines result in the formation of a triangle that appears to be symmetrical.
A symmetrical triangle pattern is usually formed when there is indecision in the price movements and there is uncertainty among the buyers and sellers. This chart pattern represents a period of consolidation before the price breaks out or breaks down. In case a breakout occurs from the upper trend line, it is a strong bullish indication as it signifies the start of a new bullish trend.
Buy Level(s): The ideal buy level for SMCI is if the stock has a daily close above the breakout level of the symmetrical triangle pattern, at around $44.40. This is marked in the chart below as a green color dotted line.
Daily chart – SMCI
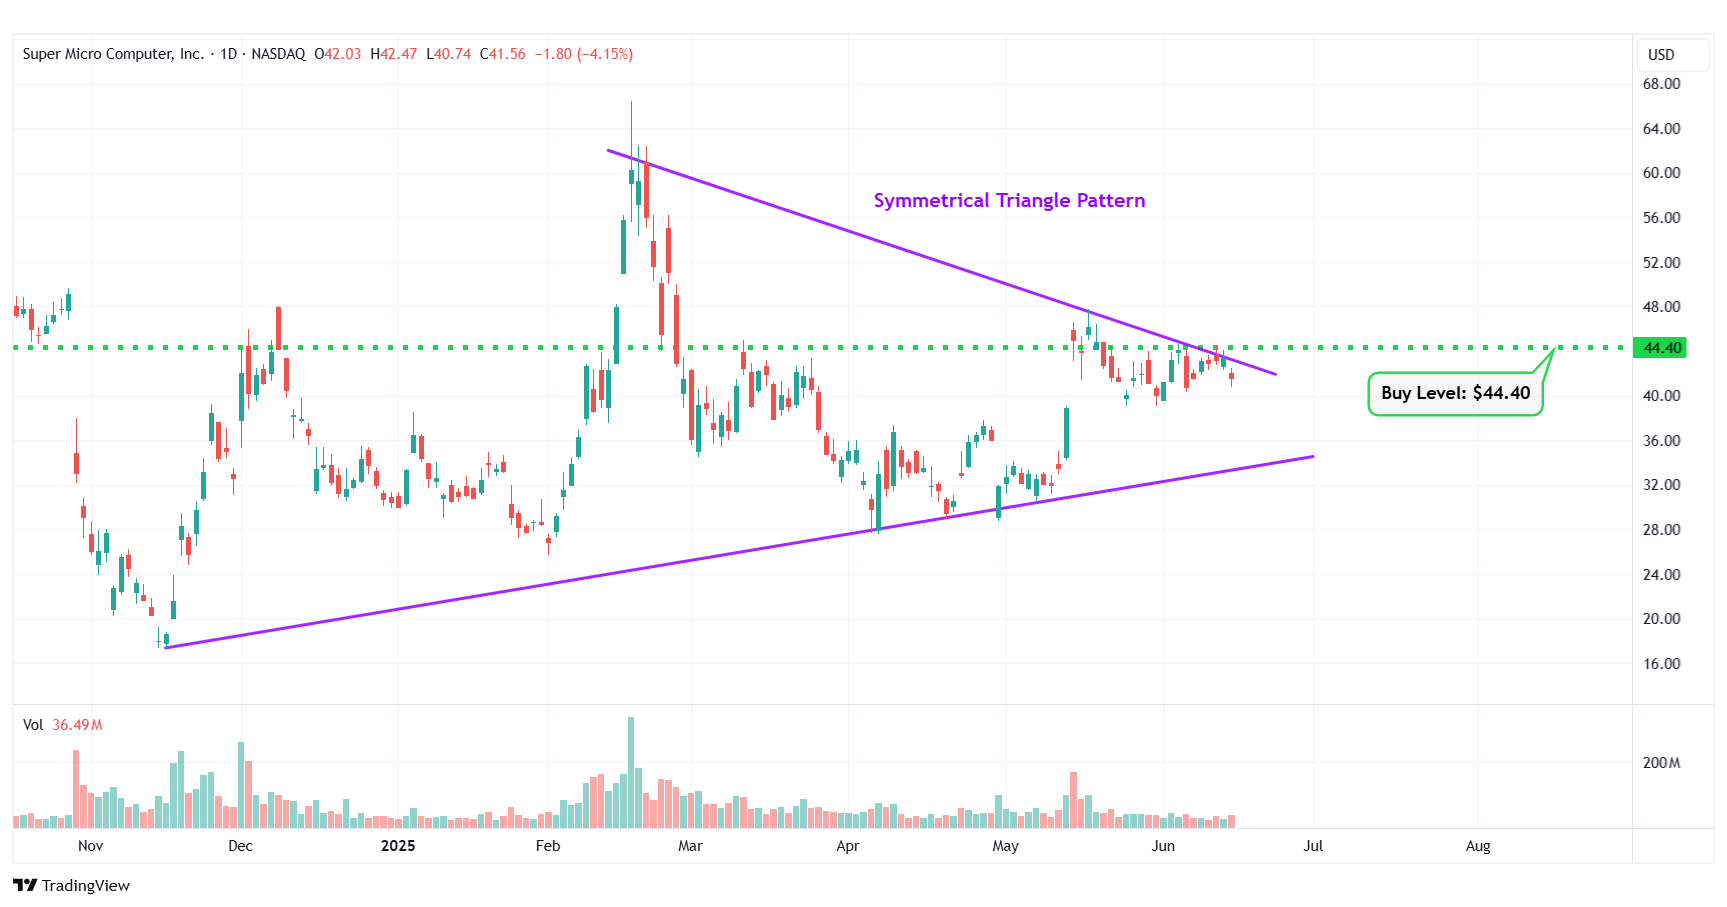
SMCI – Symmetrical Triangle Pattern
#10 Viasat, Inc. (NASDAQ: VSAT)
Sector: Technology • Communication Equipment
Reason: Breakout From a Consolidation Area in the Daily Chart
A Consolidation Area is a price action contained between two parallel lines. It is formed by a lower line that connects the lows, and an upper line that joins the highs. A stock usually trades between the two lines of the consolidation area before finally breaking out from the upper rail.
Buy Level(s): Although the stock has currently broken out of a consolidation area, the ideal buy level for VSAT is above the near-term resistance area, which translates to a price of around $12.80. This is marked in the chart below as a green color dotted line.
Daily chart – VSAT
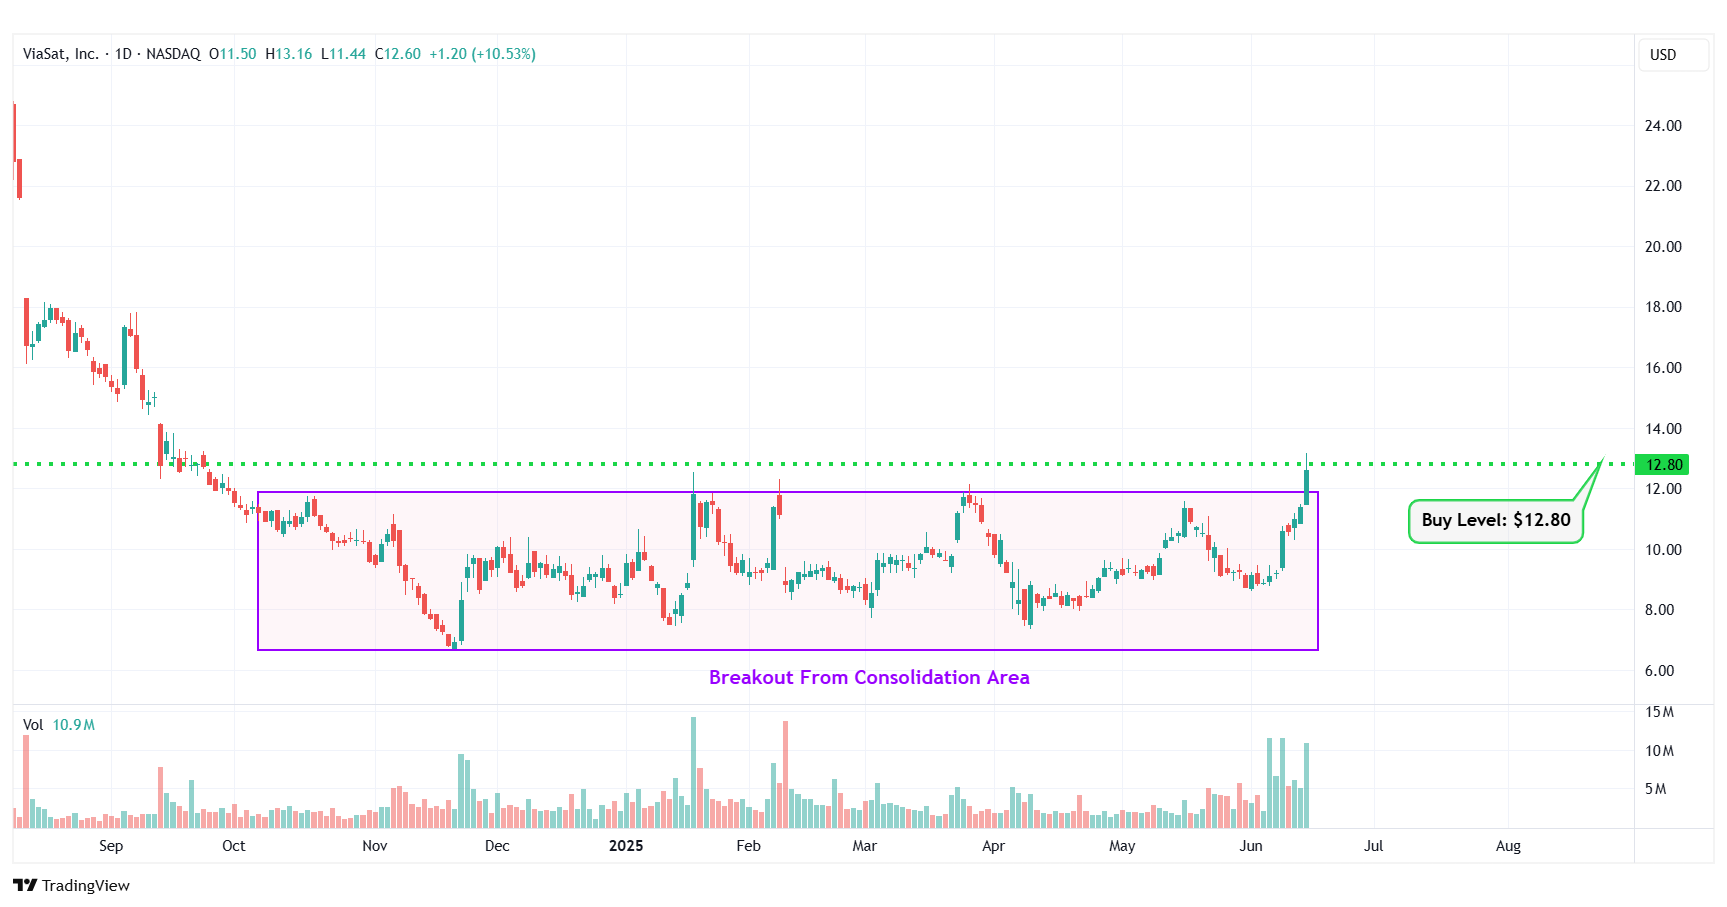
VSAT – Breakout From Consolidation Area
Happy Trading!
Trades of The Day Research Team
The old way of investing in tech giants is over. A NEW strategy unlocks 146X more income on the SAME underlying stocks (like Meta, Apple, and Amazon) -- WITHOUT options trading. Click here to uncover the NEW MAG-7 alternative.
Source: Trades of the Day
