Picking a winning trade on a consistent basis is not simply a stroke of luck. It’s the result of calculated screening, planning, and deliberation.
With this in mind, we have started a new weekly series on our top 10 stocks to watch this week — stocks that look poised for a possible breakout in the coming days. Traders should add these stocks to their watchlist now.
The Top 10 Stocks to Watch This Week for Possible Breakouts
| Sl # | Name of the Stock | Stock Ticker | Last Close | Buy Level(s) | Reason |
| 1 | Costco Wholesale Corp | NASDAQ: COST | $1,040.18 | $1,050.00 | Symmetrical Triangle Pattern Breakout |
| 2 | Zoom Communications Inc. | NASDAQ: ZM | $81.25 | $82.00 | Downtrend Channel |
| 3 | Palantir Technologies Inc. | NASDAQ: PLTR | $131.78 | $134.30 | Ascending Triangle Pattern Breakout |
| 4 | CSX Corp | NASDAQ: CSX | $31.59 | $32.00 | Downtrend Channel Breakout |
| 5 | Zscaler Inc. | NASDAQ: ZS | $275.70 | $277.00 | Uptrend Channel Breakout |
| 6 | NVIDIA Corp | NASDAQ: NVDA | $135.13 | $142.30 | Downtrend Channel Breakout |
| 7 | Walgreens Boots Alliance Inc. | NASDAQ: WBA | $11.25 | $11.45 | Symmetrical Triangle Pattern |
| 8 | Public Service Enterprise Group Inc. | NYSE: PEG | $81.03 | $81.80 | Falling Wedge Pattern Breakout |
| 9 | Telus Corp | NYSE: TU | $16.39 | $16.50 | Double Bottom Pattern Breakout |
| 10 | Dayforce Inc. | NYSE: DAY | $59.08 | $60.60 | Downtrend Channel |
Important: Typically, these trades offer a risk: reward ratio of 1:2 or 1:3 in the next 6 months, which implies 2x to 3x rewards when compared to risks. So, be sure to set your stop-loss levels and target prices accordingly to manage your risk. In addition, these trade ideas are triggered using daily closing prices, not intra-day pricing. So, if you participate in these trades, make sure that you only buy the stock once its daily close is above the recommended price level.
That said, here are the top 10 stocks to watch for a breakout, in no particular order.
#1 Costco Wholesale Corp (NASDAQ: COST)
Sector: Consumer Defensive • Discount Stores
Reason: Symmetrical Triangle Pattern Breakout
A symmetrical triangle is a chart pattern formed by two converging trend lines connecting a series of sequential peaks and troughs. These two lines result in the formation of a triangle that appears to be symmetrical.
A symmetrical triangle pattern is usually formed when there is indecision in the price movements and there is uncertainty among the buyers and sellers. This chart pattern represents a period of consolidation before the price breaks out or breaks down. In case a breakout occurs from the upper trend line, it is a strong bullish indication as it signifies the start of a new bullish trend.
Buy Level(s): The stock has currently broken out of a symmetrical triangle pattern. However, the ideal buy level for COST is if the stock closes above the immediate resistance level of $1,050.00. This is marked in the chart below as a green color dotted line.
Daily chart – COST
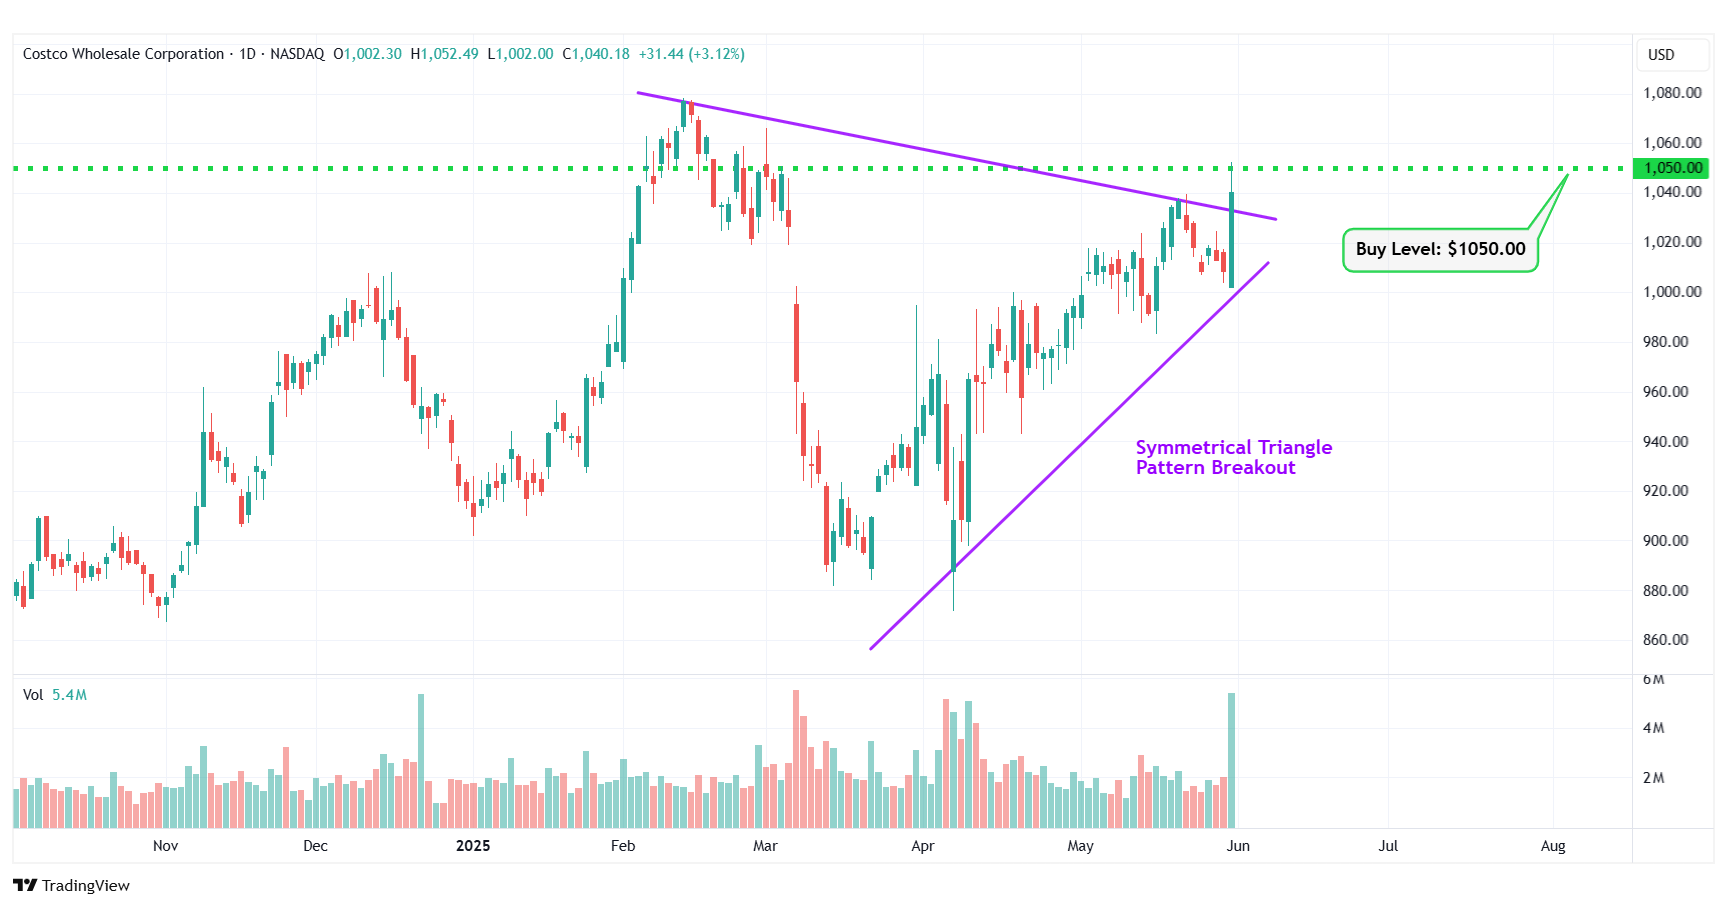
COST – Symmetrical Triangle Pattern Breakout
#2 Zoom Communications Inc. (NASDAQ: ZM)
Sector: Technology • Software – Application
Reason: Formation of a Downtrend Channel
A downtrend or descending channel is the price action contained between downward sloping parallel lines. It is formed by two lines that are drawn by connecting the lower highs and lower lows of a stock’s price. Even though this is typically a bearish pattern, a breakout from the upper rail of this pattern is considered a good bullish indication.
Buy Level(s): The daily chart shows that the stock is currently forming a downtrend channel. The ideal buy level for ZM is if the stock breaks out of the downtrend channel and has a daily close above $82.00. This is marked in the chart below as a green color dotted line.
Daily chart – ZM
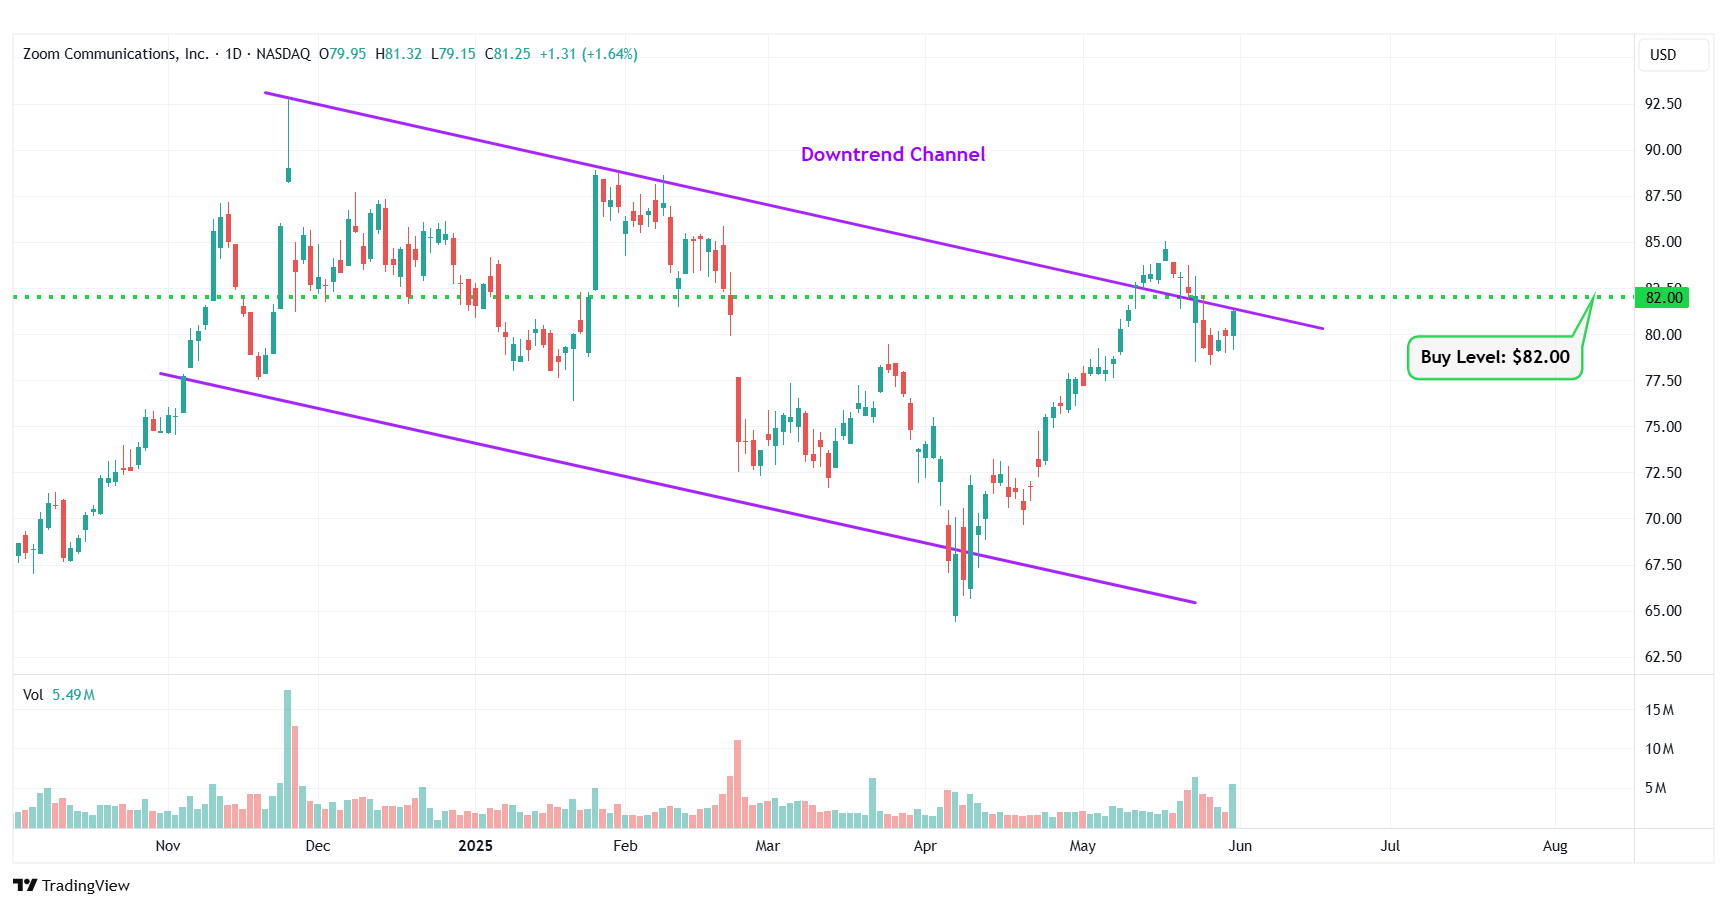
ZM – Downtrend Channel
#3 Palantir Technologies Inc. (NASDAQ: PLTR)
Sector: Technology • Software – Infrastructure
Reason: Breakout From an Ascending Triangle Pattern
An ascending triangle pattern is a bullish pattern formed by drawing a horizontal line along the swing highs, and a rising trendline along the swing lows. These two lines result in the formation of a triangle. A breakout from this pattern is typically a strong bullish indication.
Buy Level(s): Although the stock has broken out of the ascending triangle pattern, the ideal buy level for PLTR is if the stock has a daily close above the near-term resistance level of $134.30. This is marked in the chart below as a green color dotted line.
Daily chart – PLTR
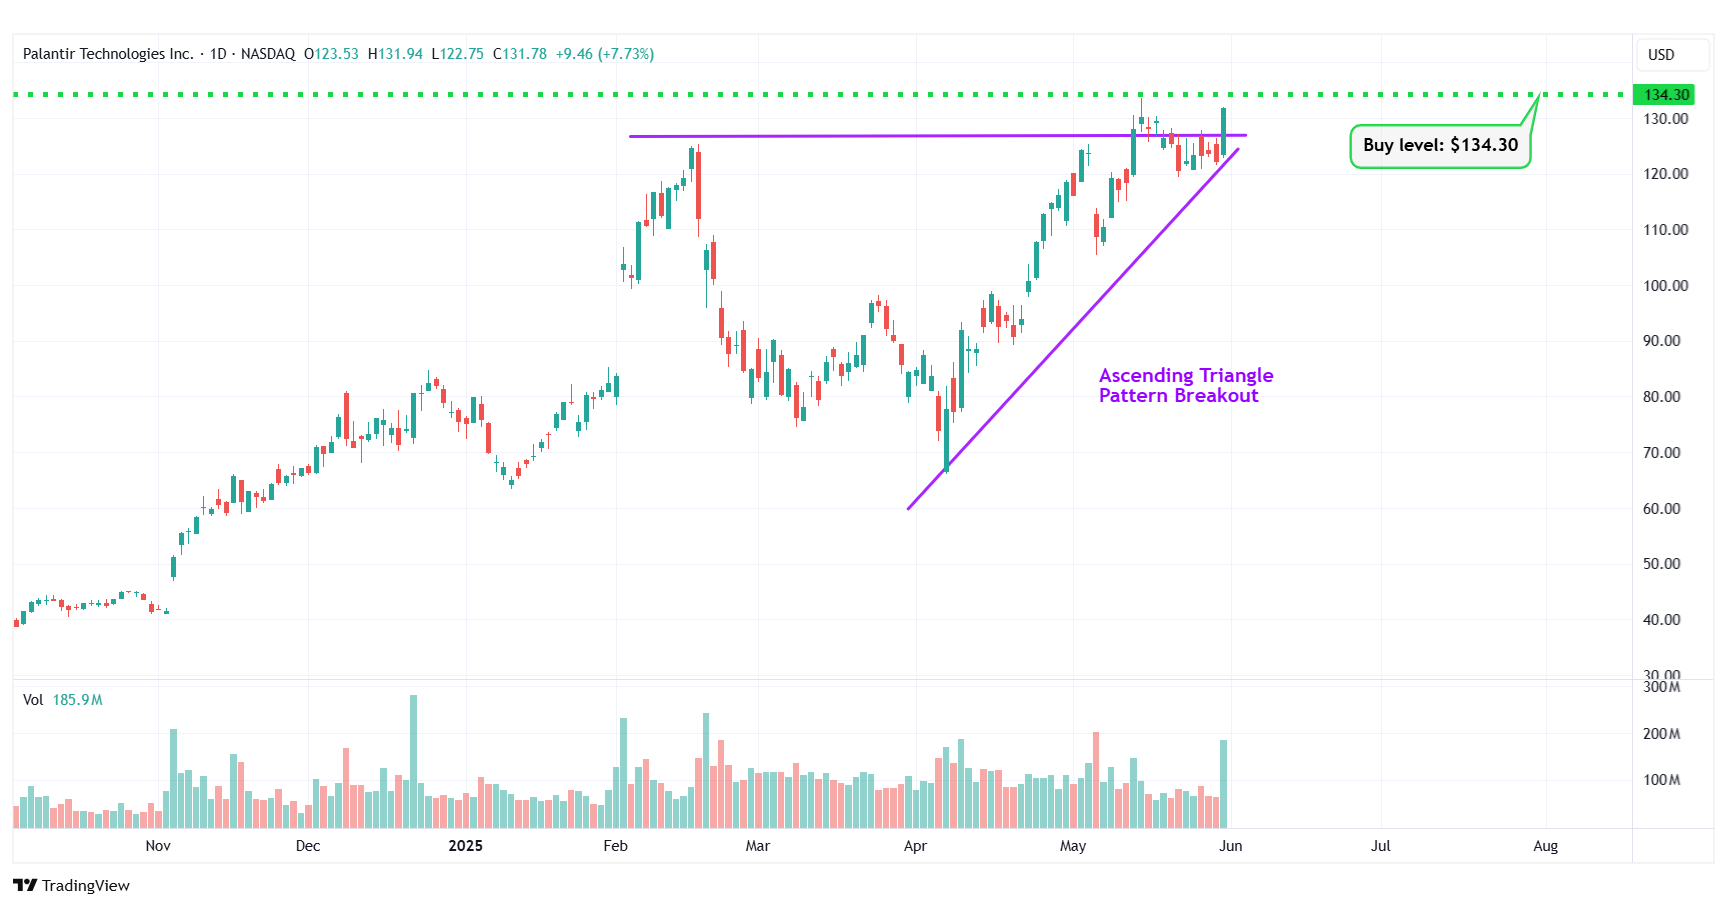
PLTR – Ascending Triangle Pattern Breakout
#4 CSX Corp (NASDAQ: CSX)
Sector: Industrials • Railroads
Reason: Downtrend Channel Breakout
A downtrend or descending channel is the price action contained between downward sloping parallel lines. It is formed by two lines that are drawn by connecting the lower highs and lower lows of a stock’s price. Even though this is typically a bearish pattern, a breakout from the upper rail of this pattern is considered a good bullish indication.
Buy Level(s): The daily chart shows that the stock has currently broken out of a downtrend channel. However, there is a near-term resistance level for the stock. Hence, the ideal buy level for CSX is if the stock has a daily close above $32.00. This is marked in the chart below as a green color dotted line.
Daily chart – CSX
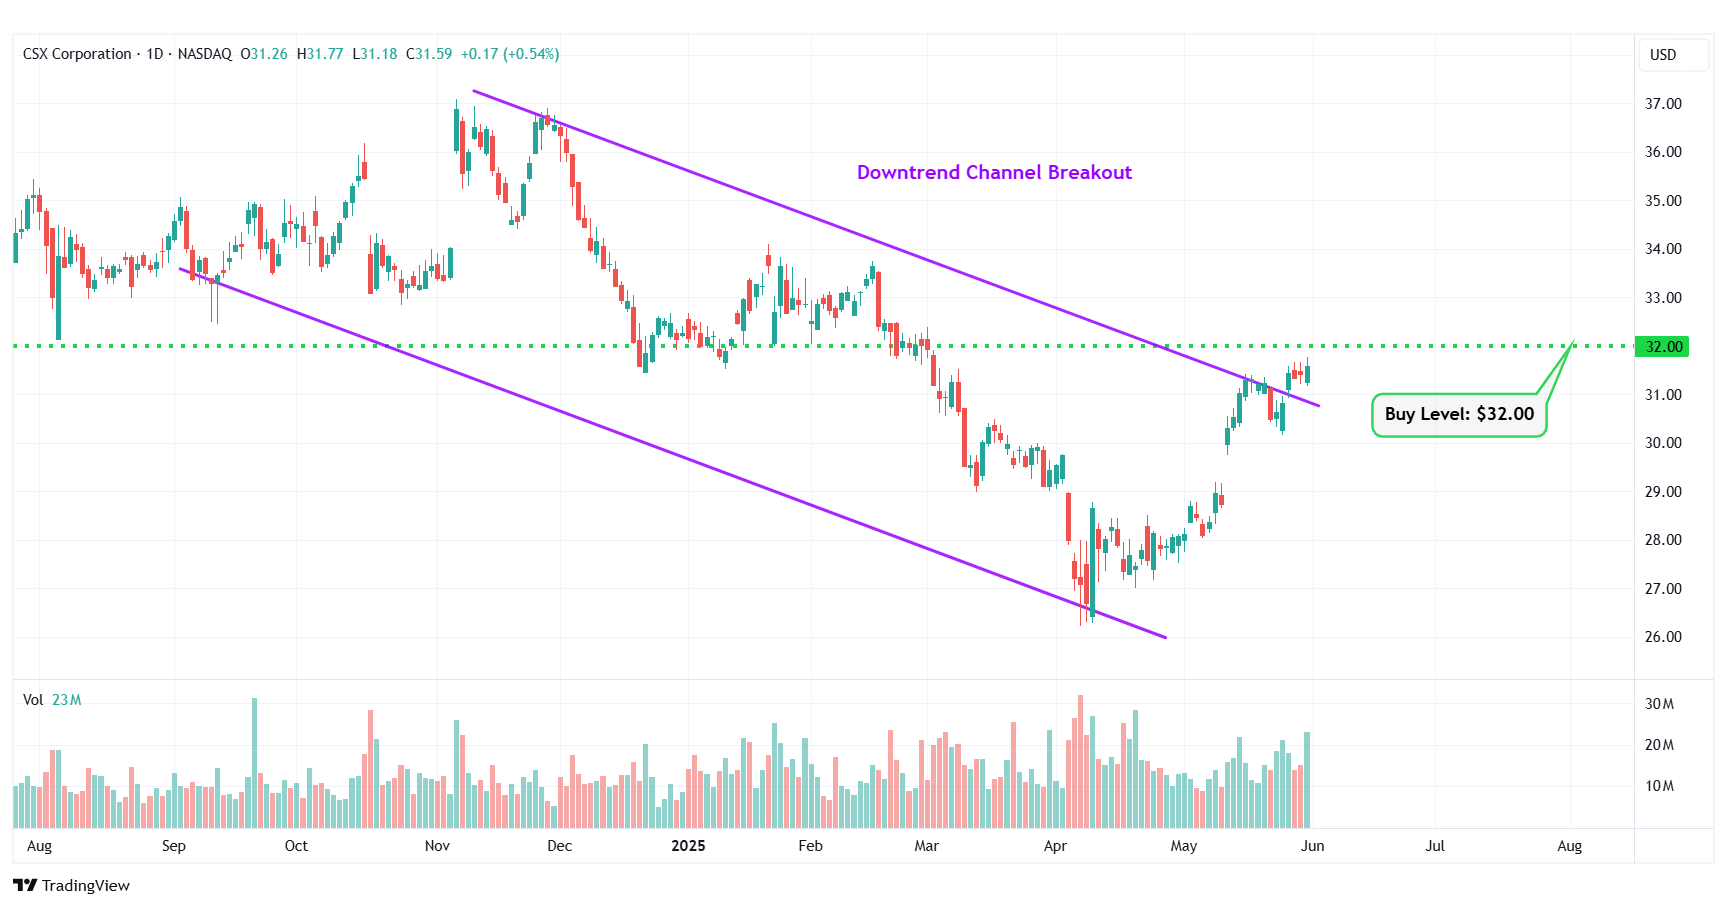
CSX – Downtrend Channel Breakout
#5 Zscaler Inc. (NASDAQ: ZS)
Sector: Technology • Software – Infrastructure
Reason: Breakout From an Uptrend Channel
An uptrend channel or an ascending channel is the price action contained between upward sloping parallel lines. It is formed by a lower trend line that connects the swing lows, and an upper channel line that joins the swing highs. A stock usually trades between the two rails of the uptrend channel before finally breaking out from the upper rail.
Buy Level(s): The stock has currently broken out of the uptrend channel. However, the ideal buy level for ZS is if the stock has a daily close above the near-term resistance level of $277.00. This is marked in the chart below as a green color dotted line.
Daily chart – ZS
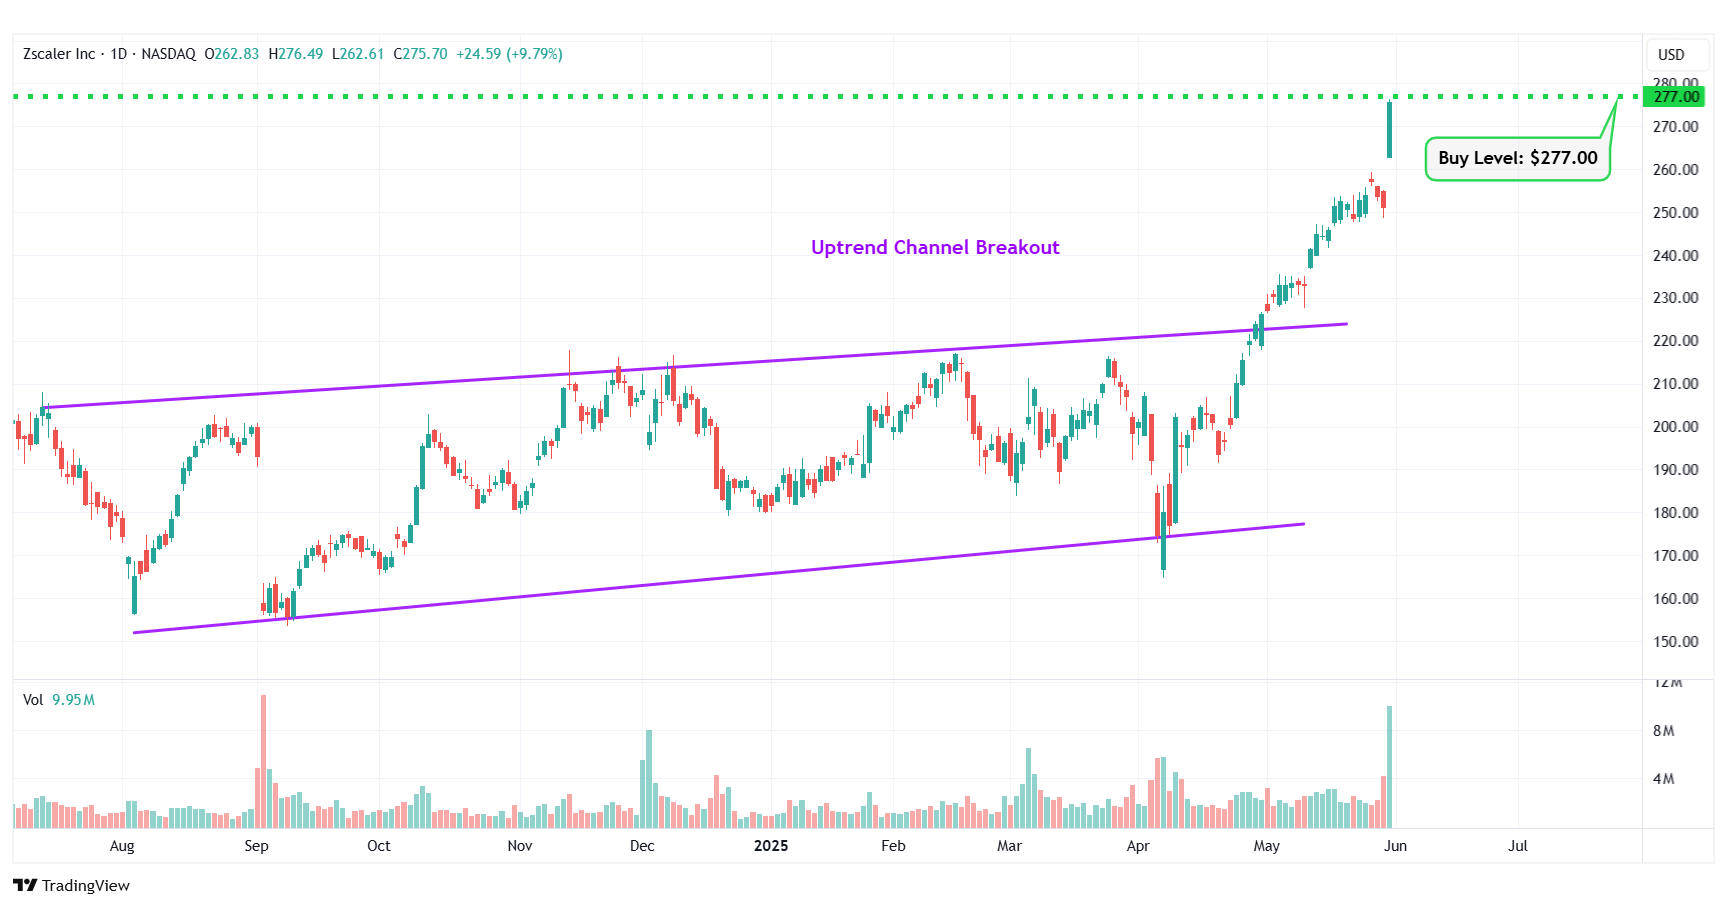
ZS – Uptrend Channel Breakout
#6 NVIDIA Corp (NASDAQ: NVDA)
Sector: Technology • Semiconductors
Reason: Downtrend Channel Breakout
A downtrend or descending channel is the price action contained between downward sloping parallel lines. It is formed by two lines that are drawn by connecting the lower highs and lower lows of a stock’s price. Even though this is typically a bearish pattern, a breakout from the upper rail of this pattern is considered a good bullish indication.
Buy Level(s): The daily chart shows that the stock has currently broken out of a downtrend channel. However, there is a near-term resistance level for the stock. Hence, the ideal buy level for NVDA is if the stock has a daily close above $142.30. This is marked in the chart below as a green color dotted line.
Daily chart – NVDA
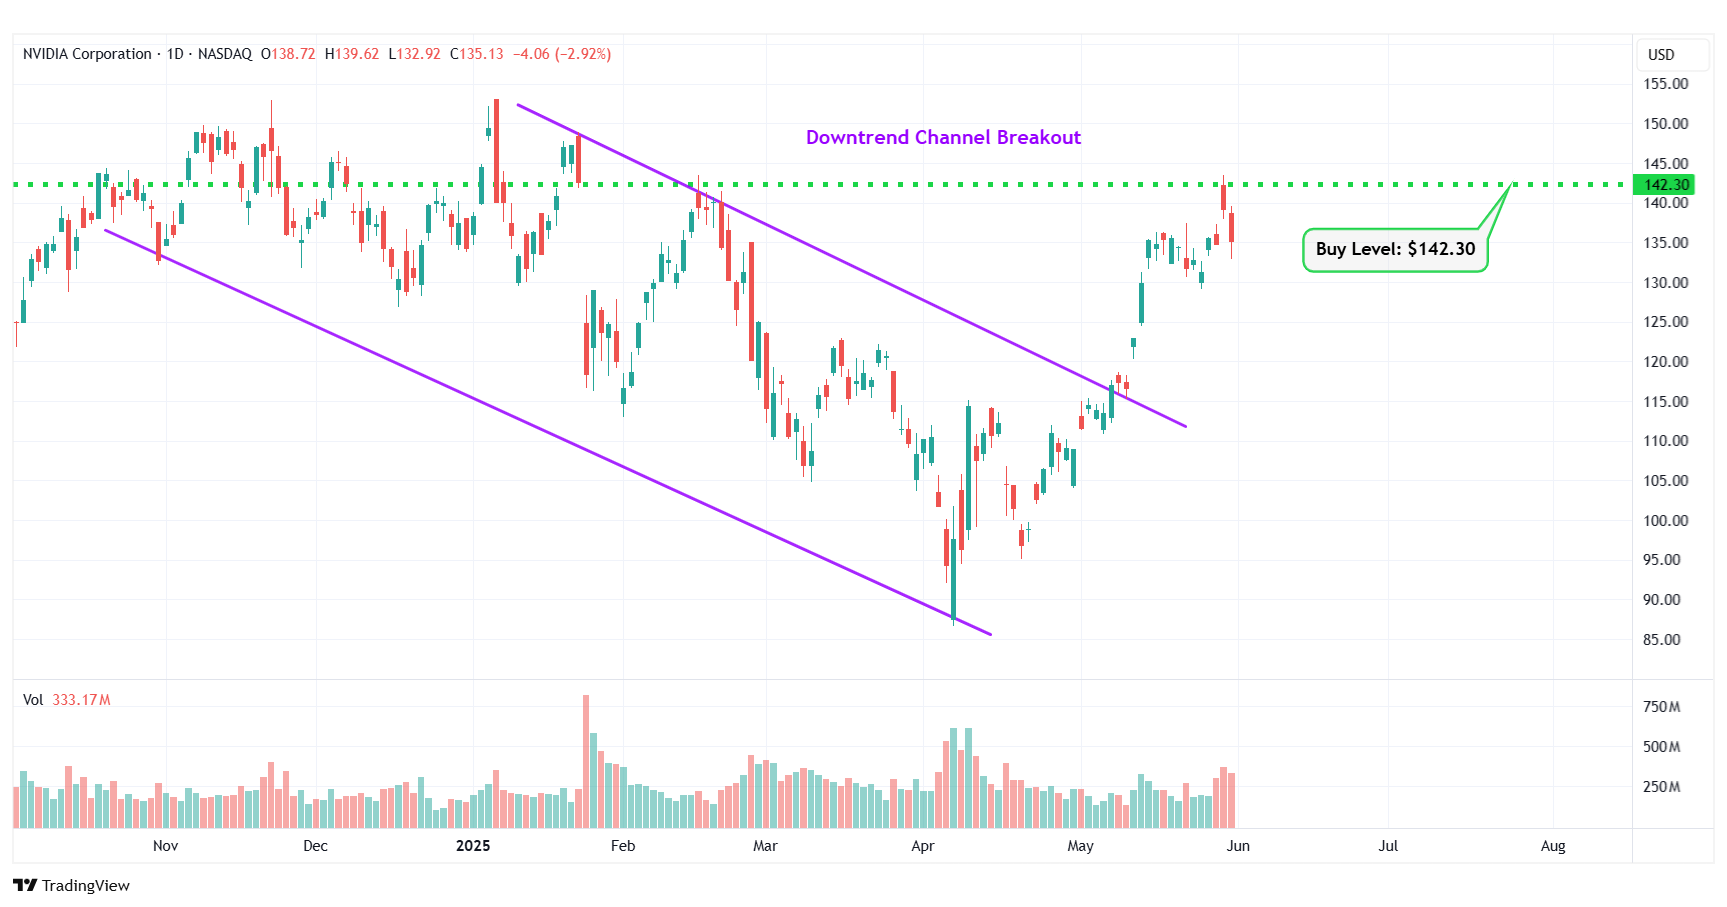
NVDA – Downtrend Channel Breakout
#7 Walgreens Boots Alliance Inc. (NASDAQ: WBA)
Sector: Healthcare • Pharmaceutical Retailers
Reason: Formation of a Symmetrical Triangle Pattern
A symmetrical triangle is a chart pattern formed by two converging trend lines connecting a series of sequential peaks and troughs. These two lines result in the formation of a triangle that appears to be symmetrical.
A symmetrical triangle pattern is usually formed when there is indecision in the price movements and there is uncertainty among the buyers and sellers. This chart pattern represents a period of consolidation before the price breaks out or breaks down. In case a breakout occurs from the upper trend line, it is a strong bullish indication as it signifies the start of a new bullish trend.
Buy Level(s): The ideal buy level for WBA is if the stock has a daily close above the breakout level of the symmetrical triangle pattern, at around $11.45. This is marked in the chart below as a green color dotted line.
Daily chart – WBA
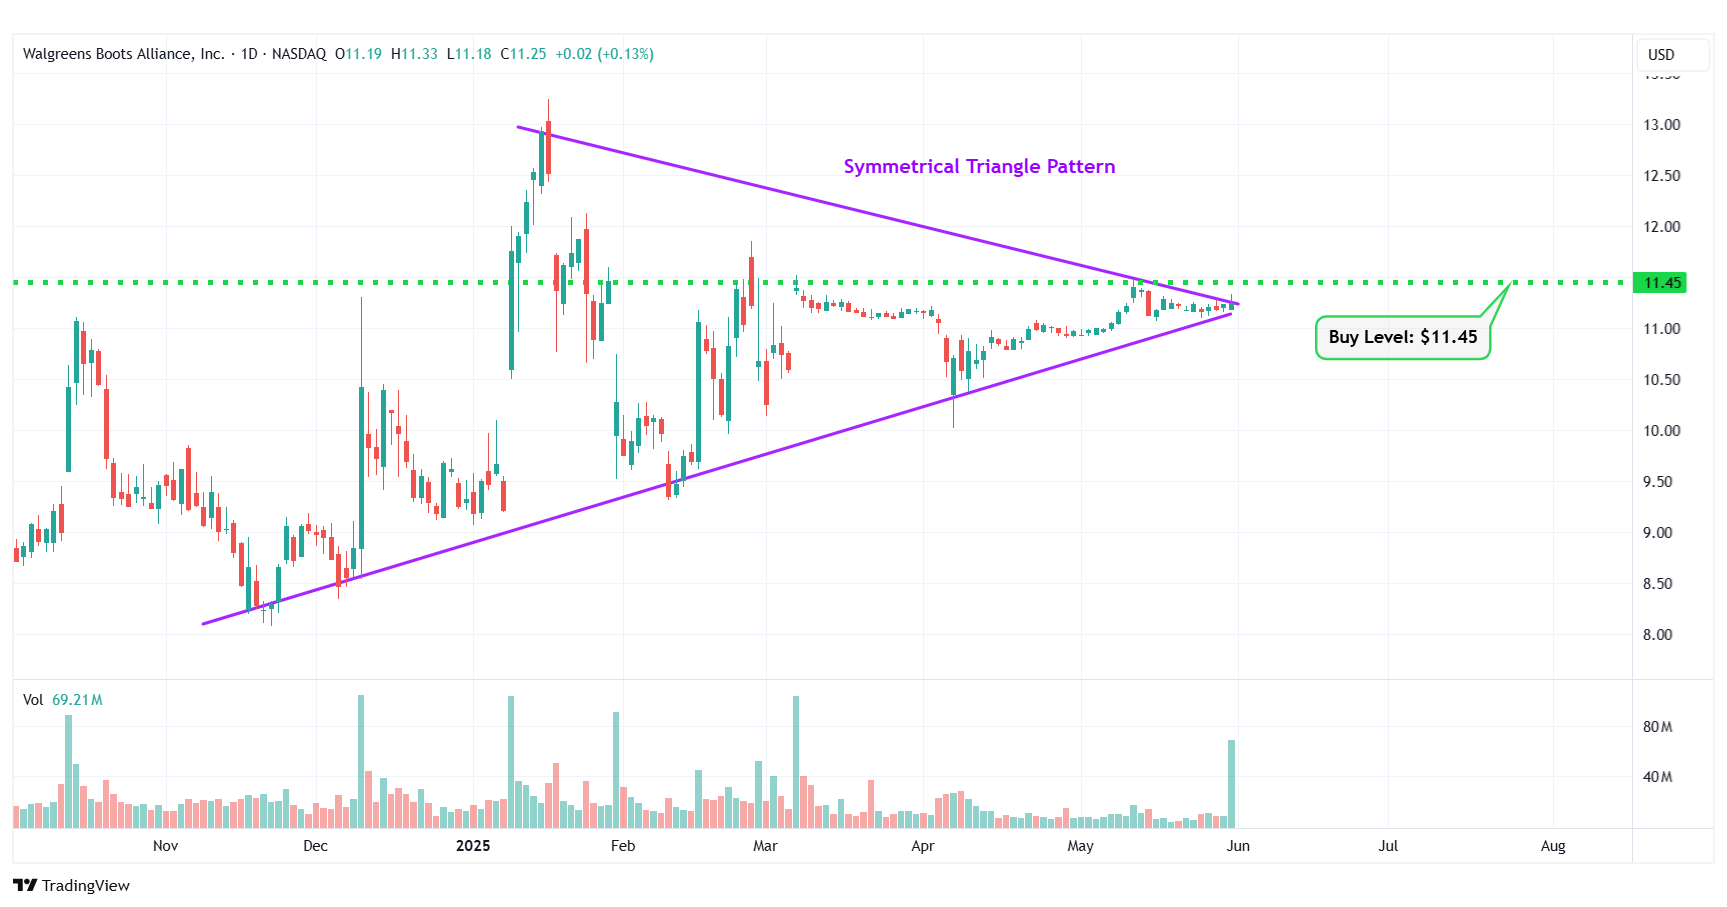
WBA – Symmetrical Triangle Pattern
#8 Public Service Enterprise Group Inc. (NYSE: PEG)
Sector: Utilities • Utilities – Regulated Electric
Reason: Falling Wedge Pattern Breakout
A falling wedge pattern is formed by joining two downward-sloping, converging trendlines having a contracting range. The pattern appears to be wide at the top and continues to contract as prices fall. A breakout from a falling wedge pattern can indicate either reversal or continuation depending on where the pattern appeared in the trend.
A stock that has broken out of a falling wedge pattern would have gained momentum and would have the potential to move higher.
Buy Level(s): The stock has currently broken out of a falling wedge pattern. However, the ideal buy level for PEG is above the nearest resistance level of $81.80. This is marked in the chart below as a green color dotted line.
Daily chart – PEG
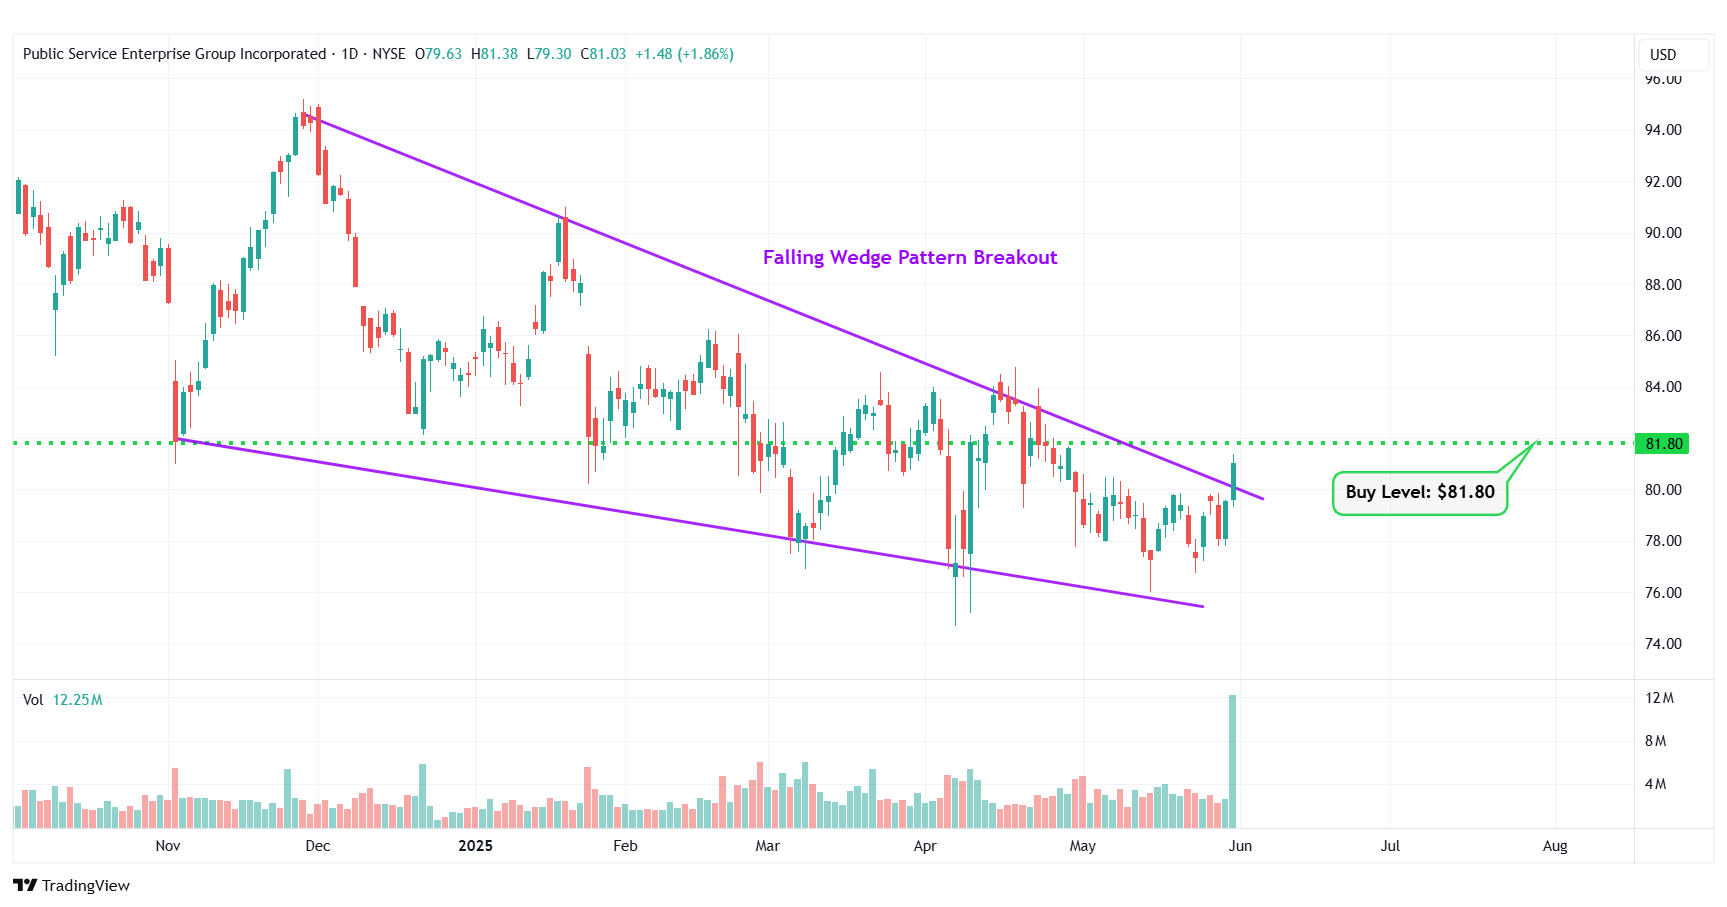
PEG – Falling Wedge Pattern Breakout
#9 Telus Corp (NYSE: TU)
Sector: Communication Services • Telecom Services
Reason: Breakout From a Double Bottom Pattern
A Double Bottom Pattern looks like the letter W and is characterized by two well-defined lows at approximately the same price level. This twice-touched low is usually a very strong support level. The high point between the two bottoms’ resistance level is called a neckline. Once a breakout happens from this key price level (neckline), it signifies the start of a bullish move.
Buy Level(s): The stock has currently broken out of the double bottom pattern. However, the ideal buy level for TU is above the near-term resistance level of around $16.50. This is marked in the chart below as a green color dotted line.
Daily chart – TU
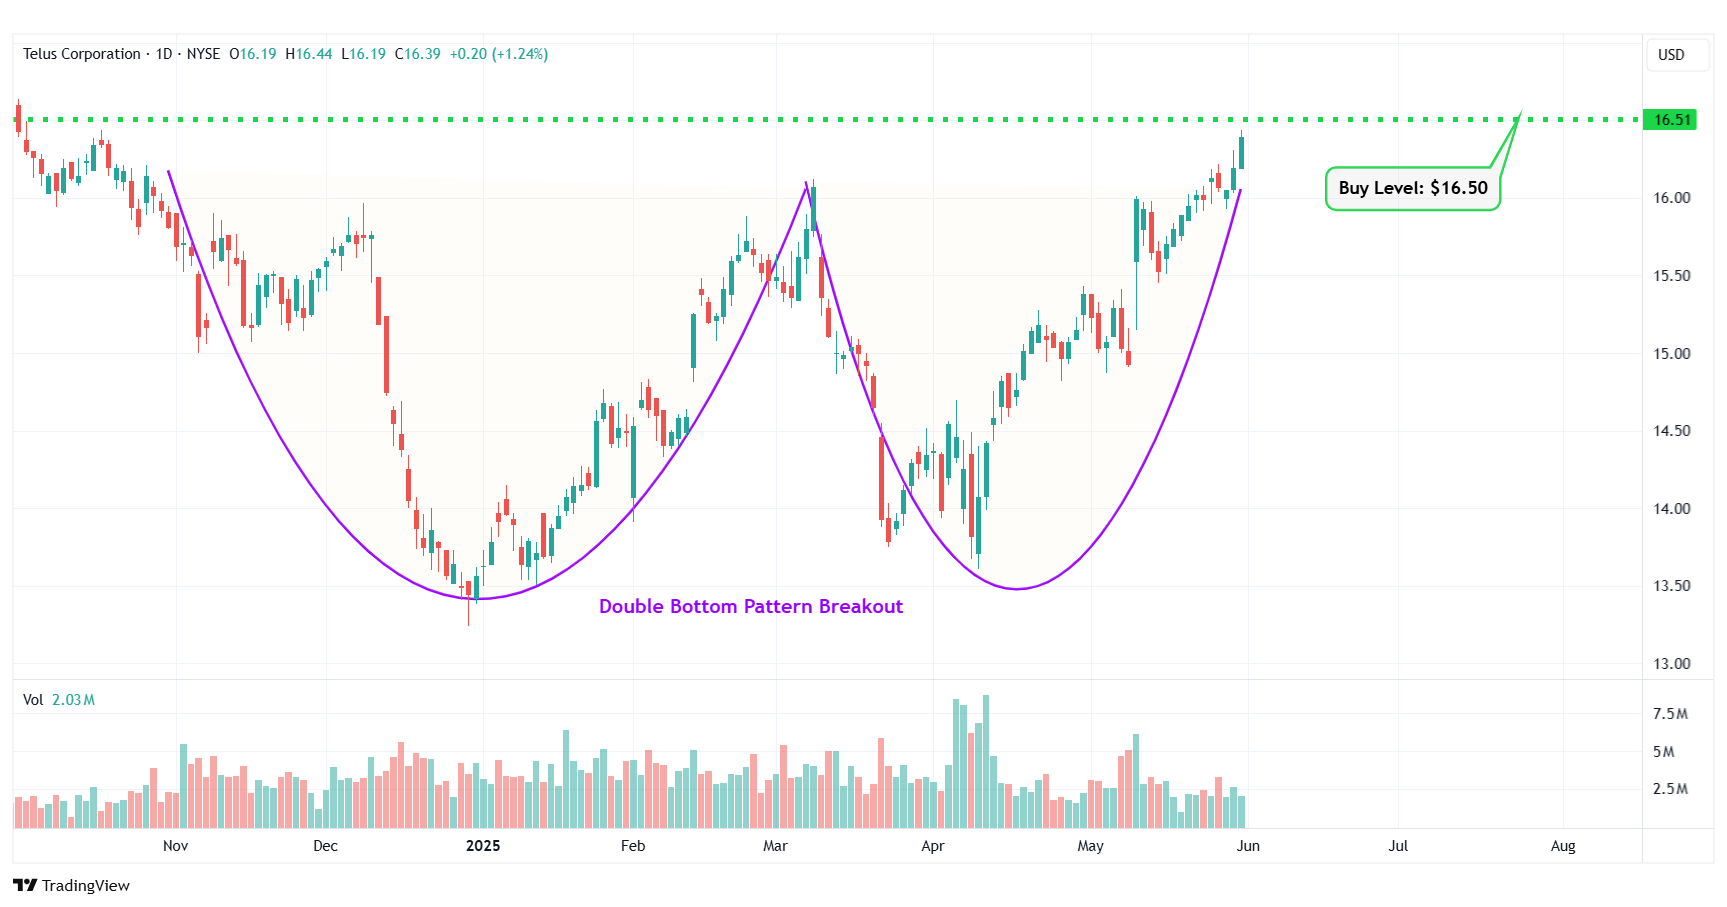
TU – Double Bottom Pattern Breakout
#10 Dayforce Inc. (NYSE: DAY)
Sector: Technology • Software – Application
Reason: Formation of a Downtrend Channel
A downtrend or descending channel is the price action contained between downward sloping parallel lines. It is formed by two lines that are drawn by connecting the lower highs and lower lows of a stock’s price. Even though this is typically a bearish pattern, a breakout from the upper rail of this pattern is considered a good bullish indication.
Buy Level(s): The daily chart shows that the stock is currently forming a downtrend channel. The ideal buy level for DAY is if the stock breaks out of the downtrend channel and has a daily close above $60.60. This is marked in the chart below as a green color dotted line.
Daily chart – DAY
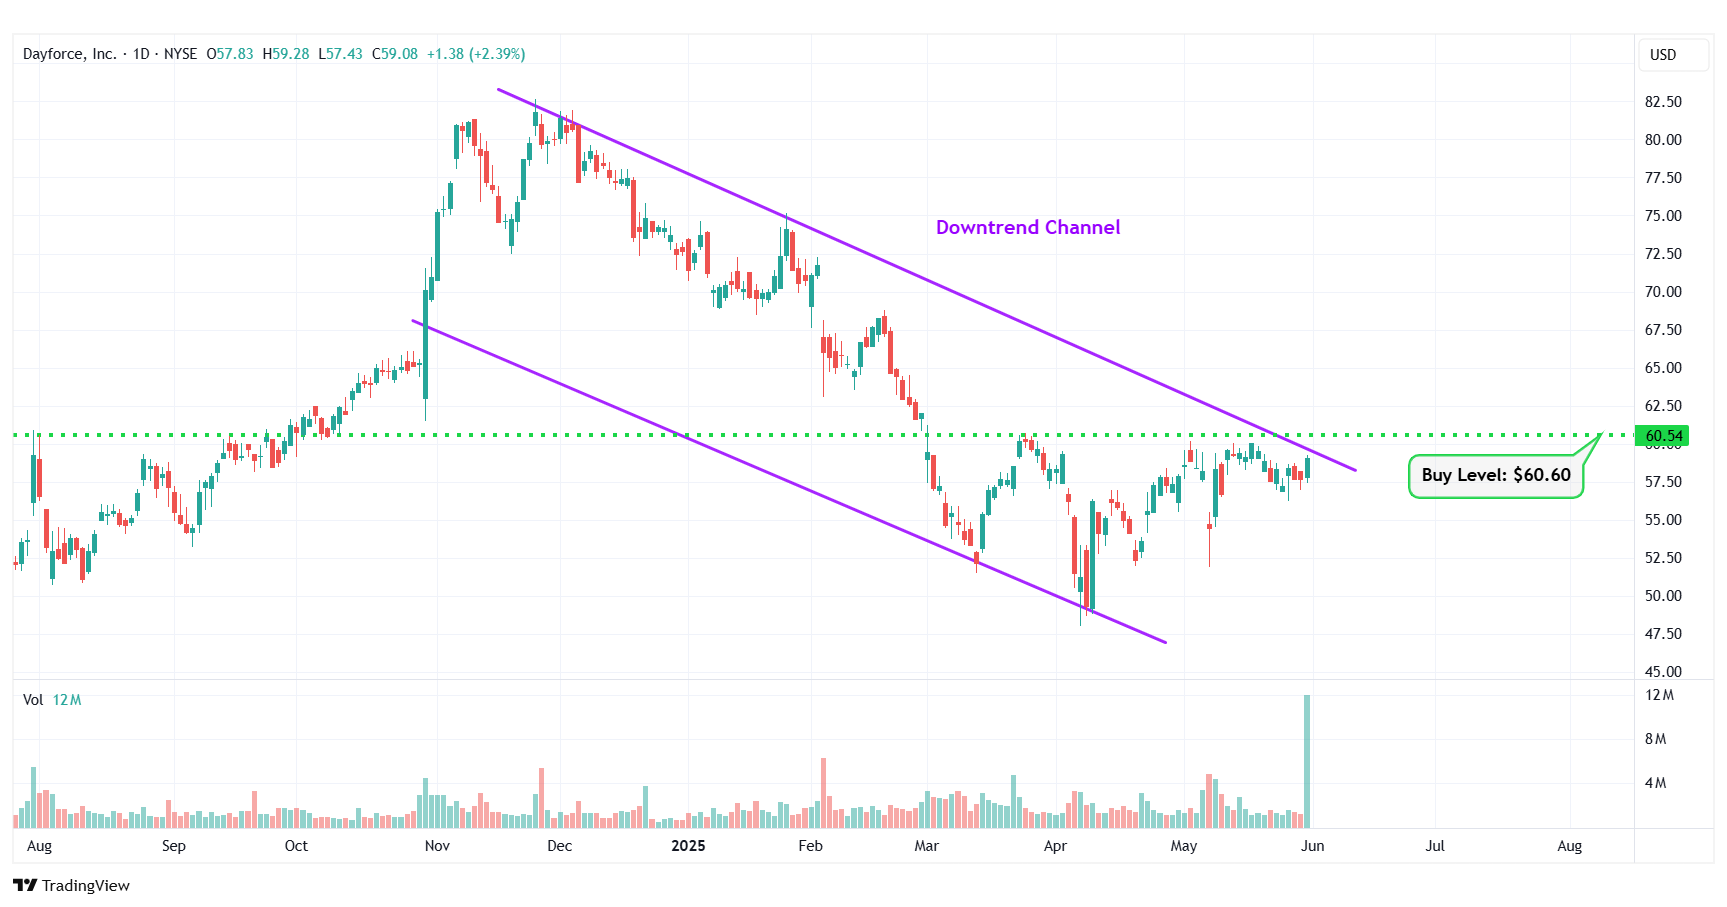
DAY – Downtrend Channel
Happy Trading!
Trades of The Day Research Team
$3 billion+ in operating income. Market cap under $8 billion. 15% revenue growth. 20% dividend growth. No other American stock but ONE can meet these criteria... here's why Donald Trump publicly backed it on Truth Social. See His Breakdown of the Seven Stocks You Should Own Here.
Source: Trades of the Day

