
Teladoc Health, Inc. (NYSE: TDOC) seems poised for a price surge based on its latest charts. The company provides virtual healthcare services worldwide. The company operates through Teladoc Health Integrated Care and BetterHelp segments.
TDOC offers virtual medical services, including general medical, expert medical, specialty medical, chronic condition management, and mental health, as well as enabling technologies and enterprise telehealth solutions for hospitals and health systems. It also operates a mental health platform that provides online counseling and therapy services.
Bullish Indications
#1 Falling Wedge Pattern Breakout: As you can see from the daily chart, the stock had been forming a falling wedge pattern for the past few weeks. These are marked as purple color lines. The stock has currently broken out of the falling wedge pattern and looks poised for an upmove. A falling wedge is a bullish pattern and a breakout from it implies that the stock may move higher in the short term.
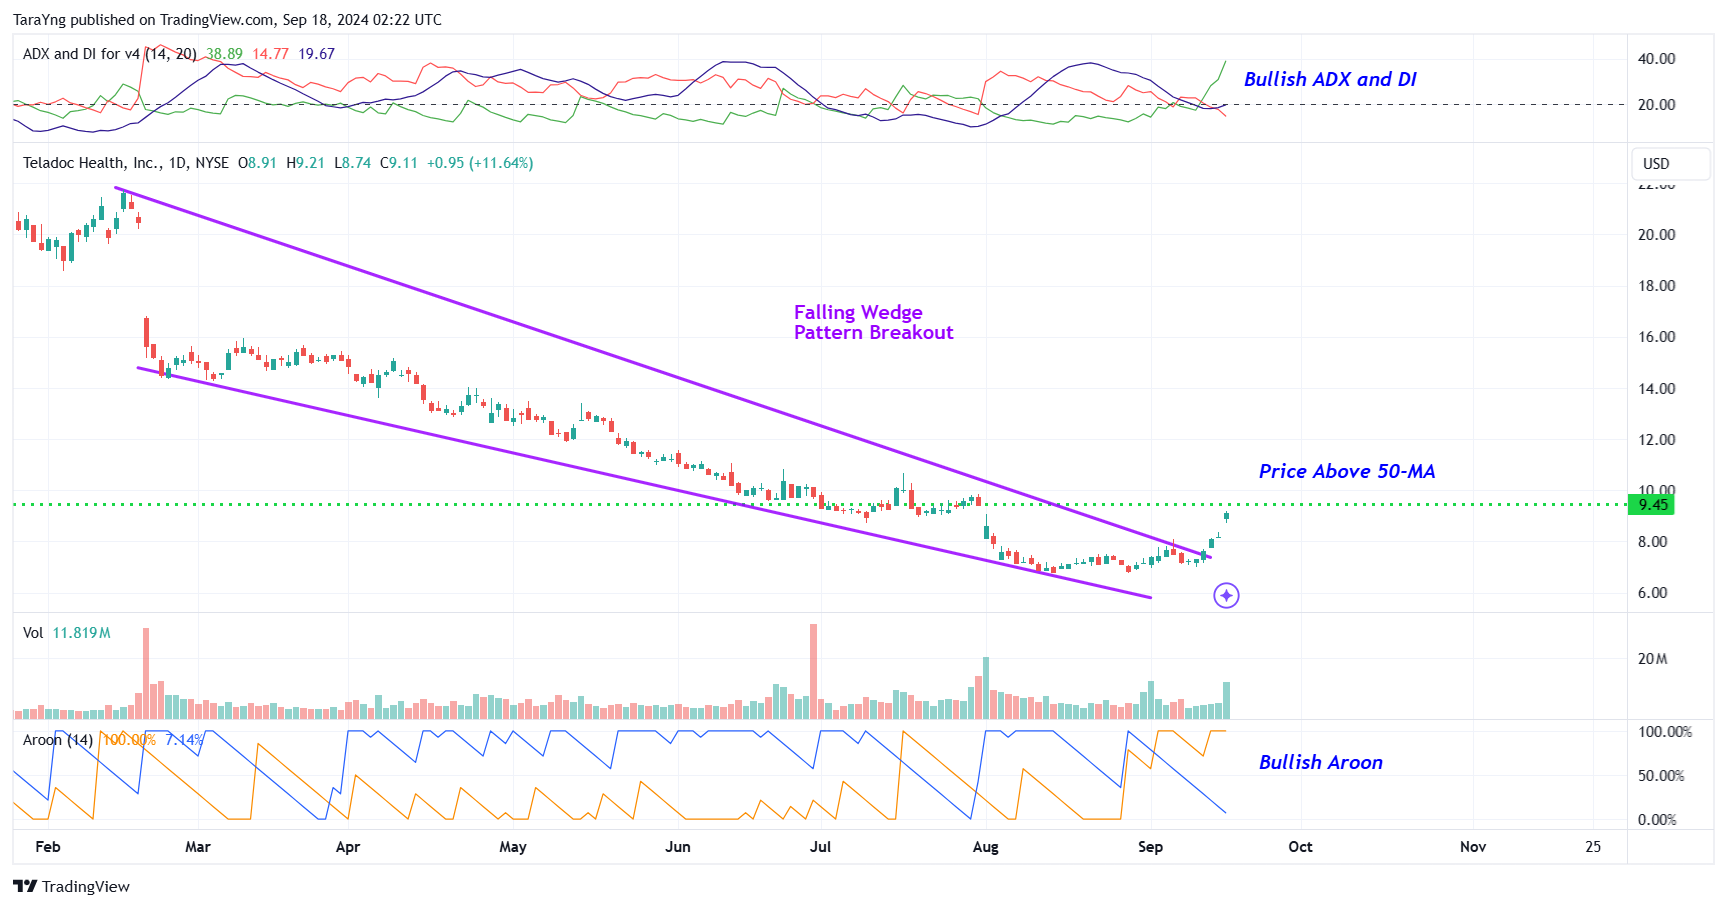
TDOC – Daily Chart
#2 Price above MA: The price is currently above the short-term moving average of 50-day SMA, indicating that the bulls are gaining control. This is a positive indication.
#3 Bullish ADX: The ADX indicator shows that the +DI line is currently above the –DI line and the ADX line has started to move up from below the –DI and +DI lines. This indicates possible bullishness.
#4 Bullish Aroon: The value of Aroon Up (orange line) is above 70 while Aroon Down (blue line) is below 30 in the daily chart. This indicates possible bullishness.
#5 Above Support Area: As you can see from the weekly chart, the stock has currently moved up from a support level. This level is marked as a pink color dotted line. This looks like a good area for the stock to move higher.
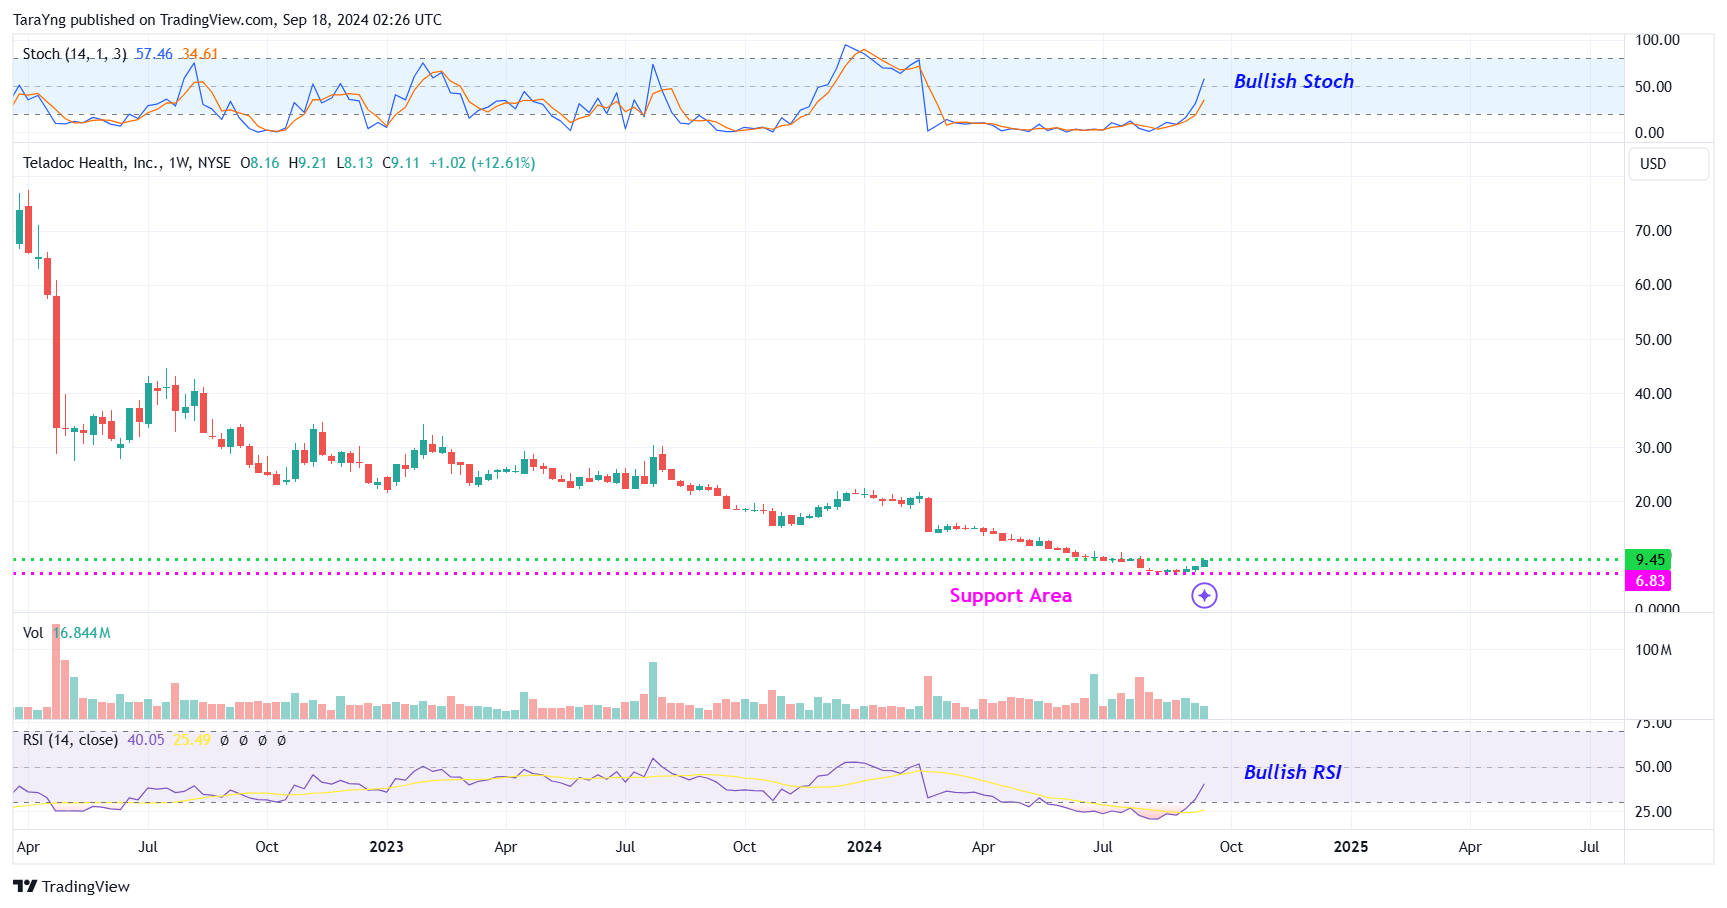
TDOC – Weekly Chart
#6 %K above %D: The %K (blue) line of stochastic has currently crossed above the %D (Orange) line in the weekly chart and is also moving higher from oversold levels. This is a possible bullish indication.
#7 Bullish RSI: In the weekly chart, the RSI is currently moving higher from oversold levels and is nearing 50. This is a possible bullish sign.
Recommended Trade (based on the charts)
Buy Levels: If you want to get in on this trade, you can purchase shares of TDOC above the price of around $9.45.
TP: Our target prices are $11.80 and $14.00 in the next 3-6 months.
SL: To limit risk, place stop-loss at $8.00. Note that the stop-loss is on a closing basis.
Our target potential upside is 25% to 48% in the next 3 to 6 months.
For a risk of $1.45, our target rewards are $2.35 and $4.55. This is a nearly 1:2 and 1:3 risk-reward trade.
In other words, this trade offers nearly 2x to 3x more potential upside than downside.
Risks to Consider
The stock may reverse its overall trend if it breaks down from the falling wedge pattern with a high volume. The sell-off of the stock could also be triggered in case of any negative news, overall weakness in the market, or any regulatory changes in the sector.
Happy Trading!
Tara
If you're buying rare earth or other critical mineral stocks, you're already one step behind - because we believe that political insiders in Washington are preparing to buy a whole new group of stocks, which could begin soaring 500%+ just days from now. The man once ranked in 2020 as America's #1 stock picker is doing something extraordinary and giving away the name and ticker of every single stock that could be next. Everything you need to know is here.
Source: Trades of the Day
