
KE Holdings Inc. (NYSE: BEKE) seems to be poised for a price surge as per its latest charts. The company designs, develops, and engages in operating an integrated online and offline platform for housing transactions and services in the People’s Republic of China. It operates through four segments: Existing Home Transaction Services, New Home Transaction Services, Home Renovation and Furnishing, and Emerging and Other Services.
Bullish Indications
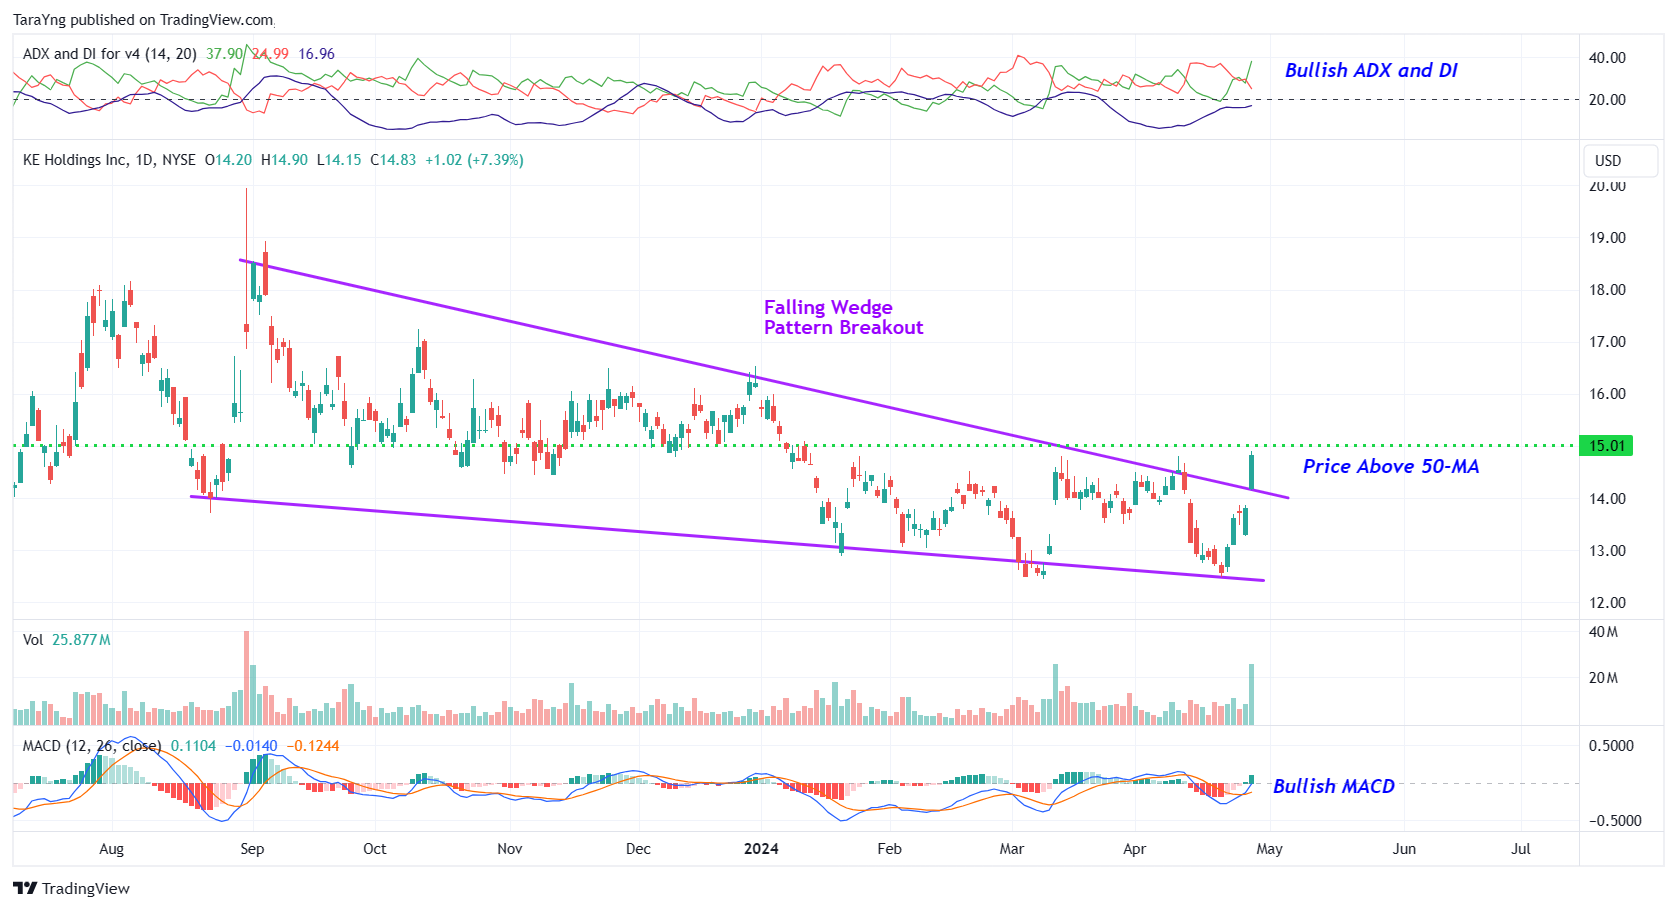
#1 Falling Wedge Pattern Breakout: As you can see from the daily chart, the stock had been forming a falling wedge pattern for the past few weeks. These are marked as purple color lines. The stock has currently broken out of the falling wedge pattern with a high volume and looks poised for an upmove. A falling wedge is a bullish pattern and a breakout from it implies that the stock may move higher in the short term.
BEKE – Daily Chart
#2 Price above MA: The price is currently above the short-term moving average of 50-day SMA, indicating that the bulls are gaining control. This is a positive indication.
#3 MACD Above Signal Line: In the daily chart, the MACD line (light blue color) is currently above the MACD signal line (orange color) which is typically considered bullish.
#4 Bullish ADX: The ADX indicator shows that the +DI line is currently above the –DI line and the ADX line has started to move up from below the –DI and +DI lines. This indicates possible bullishness.
#5 Above Support Area: As you can see from the weekly chart, the stock has currently moved up from a strong support level. This level is marked as a pink color dotted line. This looks like a good area for the stock to move higher.

BEKE – Weekly Chart
#6 %K above %D: The %K (blue) line of stochastic has currently crossed above the %D (Orange) line in the weekly chart and is also moving higher from oversold levels. This is a possible bullish indication.
#7 Bullish RSI: In the weekly chart, the RSI is currently above 50 and moving higher. This is a possible bullish sign.
Recommended Trade (based on the charts)
Buy Levels: If you want to get in on this trade, you can purchase shares of BEKE above the price of around $15.10.
TP: Our target prices are $17.50 and $19.30 in the next 3-6 months.
SL: To limit risk, place stop-loss at $13.70. Note that the stop-loss is on a closing basis.
Our target potential upside is 16% to 28% in the next 3 to 6 months.
For a risk of $1.40, our target rewards are $2.40 and $4.20. This is a nearly 1:2 and 1:3 risk-reward trade.
In other words, this trade offers nearly 2x to 3x more potential upside than downside.
Risks to Consider
The stock may reverse its overall trend if it breaks down from the falling wedge pattern with a high volume. The sell-off of the stock could also be triggered in case of any negative news, overall weakness in the market, or any regulatory changes in the sector.
Happy Trading!
Tara
Everyone wants to know when to buy, sell, or hold a stock. FAST Graphs reveals this by clearly illustrating the value of the business relative to its stock price. Get 25% off using Daily Trade Alert's special referral link and coupon code AFFILIATE25
Source: Trades of the Day
