
Picking a winning trade on a consistent basis is not simply a stroke of luck. It’s the result of calculated screening, planning, and deliberation.
With this in mind, we have started a new weekly series on our top 10 stocks to watch this week — stocks that look poised for a possible breakout in the coming days. Traders should add these stocks to their watchlist now.
The Top 10 Stocks to Watch This Week for Possible Breakouts
| Sl # | Name of the Stock | Stock Ticker | Last Close | Buy Level(s) | Reason |
| 1 | SoFi Technologies Inc. | NASDAQ: SOFI | $7.87 | $8.10 | Symmetrical Triangle Pattern |
| 2 | Iridium Communications Inc. | NASDAQ: IRDM | $31.37 | $33.70 | Falling Wedge Pattern Breakout |
| 3 | Zim Integrated Shipping Services Ltd | NYSE: ZIM | $13.22 | $13.50 | Symmetrical Triangle Pattern Breakout |
| 4 | TripAdvisor Inc. | NASDAQ: TRIP | $27.45 | $27.80 | Flag Pattern Breakout |
| 5 | Koninklijke Philips N.V. ADR | NYSE: PHG | $21.07 | $21.50 | Symmetrical Triangle Pattern Breakout |
| 6 | Fulton Financial Corp. | NASDAQ: FULT | $15.62 | $16.00 | Downtrend Channel |
| 7 | U.S. Silica Holdings Inc. | NYSE: SLCA | $15.89 | $16.10 | Symmetrical Triangle Pattern Breakout |
| 8 | Gamestop Corporation | NYSE: GME | $11.90 | $12.50 | Falling Wedge Pattern |
| 9 | Viking Therapeutics Inc. | NASDAQ: VKTX | $74.31 | $77.00 | Symmetrical Triangle Pattern Breakout |
| 10 | Resmed Inc. | NYSE: RMD | $218.06 | $223.00 | Symmetrical Triangle Pattern Breakout |
Important: Typically, these trades offer a risk: reward ratio of 1:2 or 1:3 in the next 6 months, which implies 2x to 3x rewards when compared to risks. So, be sure to set your stop-loss levels and target prices accordingly to manage your risk. In addition, these trade ideas are triggered using daily closing prices, not intra-day pricing. So, if you participate in these trades, make sure that you only buy the stock once its daily close is above the recommended price level.
That said, here are the top 10 stocks to watch for a breakout, in no particular order.
#1 SoFi Technologies Inc. (NASDAQ: SOFI)
Sector: Financial • Credit Services
Reason: Formation of a Symmetrical Triangle Pattern
A symmetrical triangle is a chart pattern formed by two converging trend lines connecting a series of sequential peaks and troughs. These two lines result in the formation of a triangle that appears to be symmetrical.
A symmetrical triangle pattern is usually formed when there is indecision in the price movements and there is uncertainty among the buyers and sellers. This chart pattern represents a period of consolidation before the price breaks out or breaks down. In case a breakout occurs from the upper trend line, it is a strong bullish indication as it signifies the start of a new bullish trend.
Buy Level(s): The ideal buy level for SOFI is if the stock has a daily close above the breakout level of the symmetrical triangle pattern, at around $8.10. This is marked in the chart below as a green color dotted line.
Daily chart – SOFI
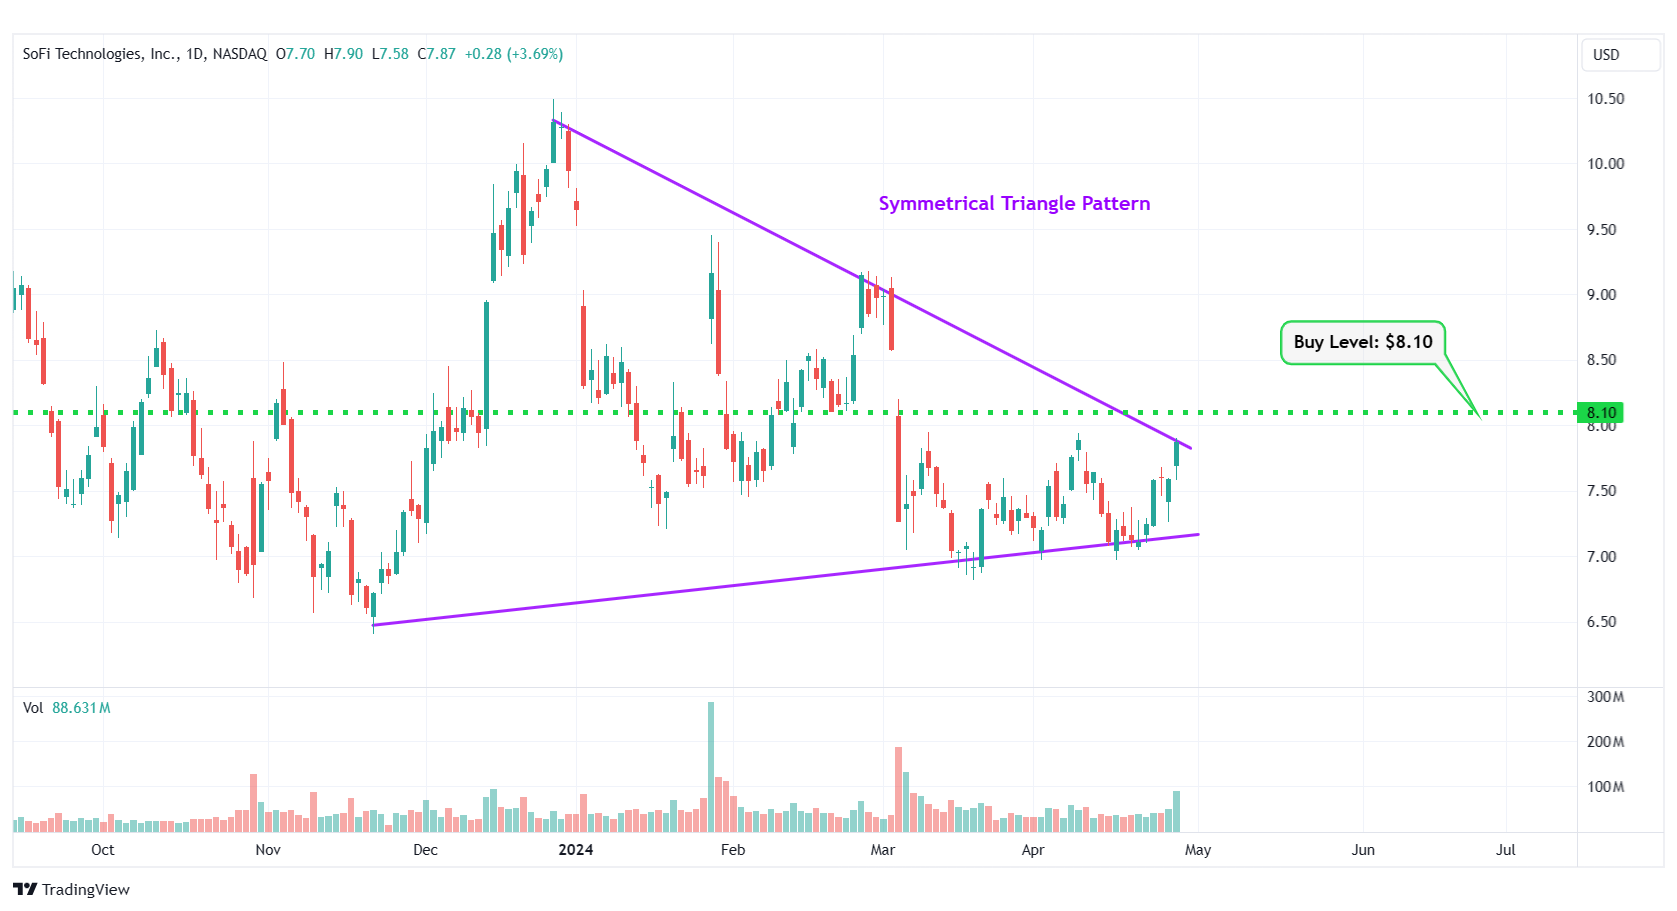
SOFI – Symmetrical Triangle Pattern
#2 Iridium Communications Inc. (NASDAQ: IRDM)
Sector: Communication Services • Telecom Services
Reason: Falling Wedge Pattern Breakout
A falling wedge pattern is formed by joining two downward-sloping, converging trendlines having a contracting range. The pattern appears to be wide at the top and continues to contract as prices fall. A breakout from a falling wedge pattern can indicate either reversal or continuation depending on where the pattern appeared in the trend.
A stock that has broken out of a falling wedge pattern would have gained momentum and would have the potential to move higher.
Buy Level(s): The stock has currently broken out of a falling wedge pattern. However, the ideal buy level for IRDM is above the nearest resistance level of $33.70. This is marked in the chart below as a green color dotted line.
Daily chart – IRDM
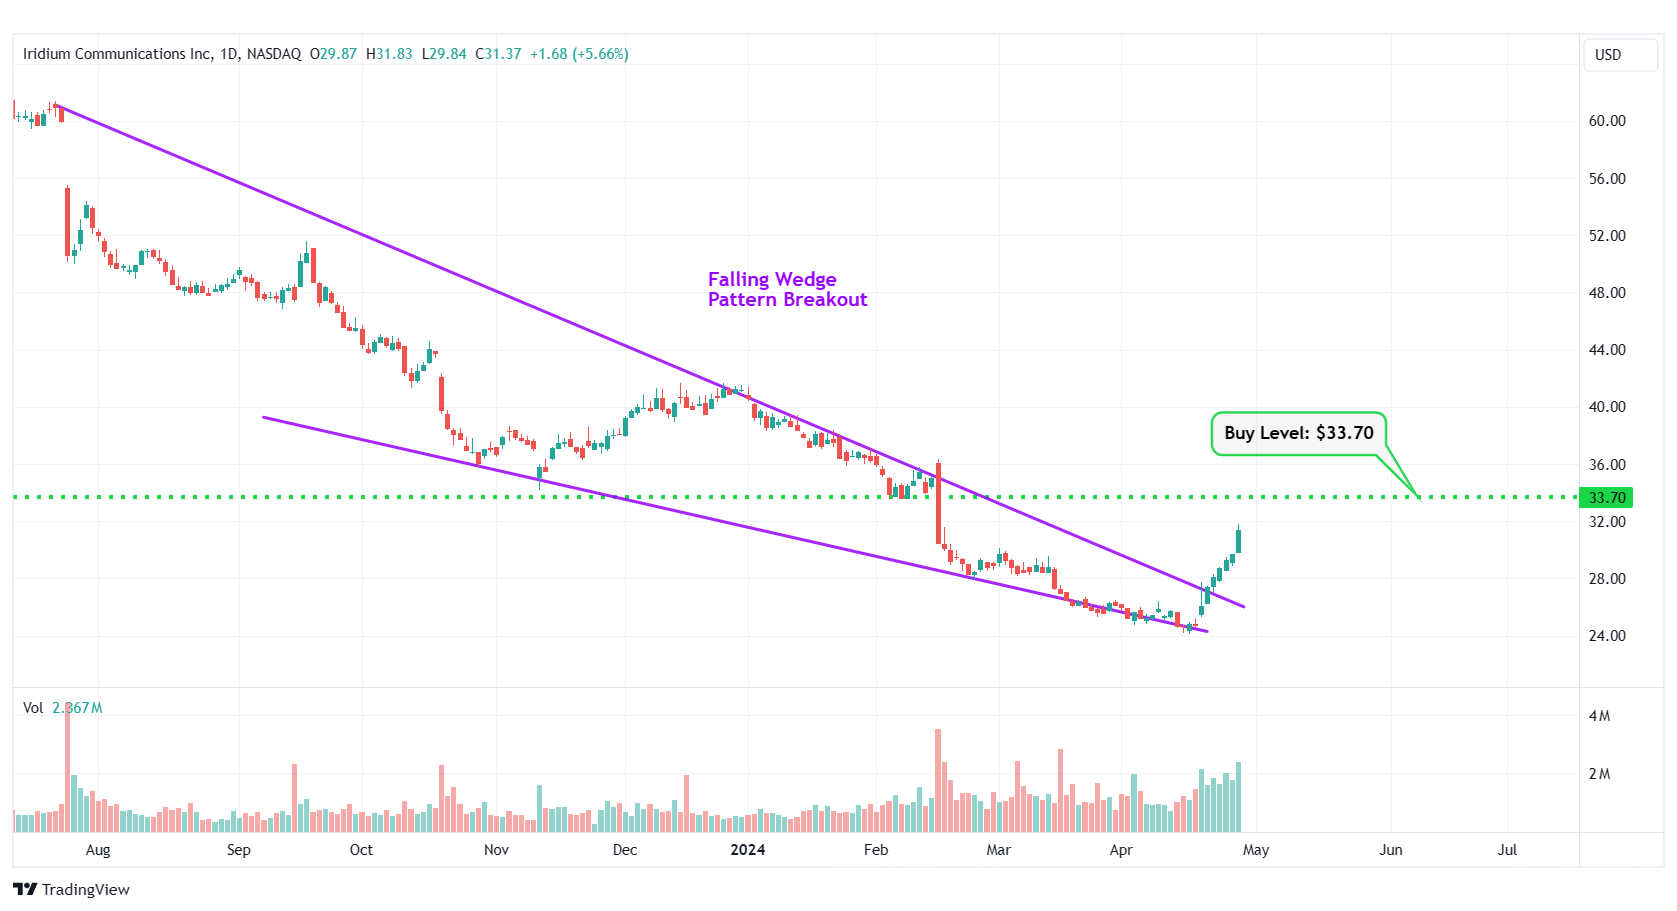
IRDM – Falling Wedge Pattern Breakout
#3 Zim Integrated Shipping Services Ltd (NYSE: ZIM)
Sector: Industrials • Marine Shipping
Reason: Symmetrical Triangle Pattern Breakout
A symmetrical triangle is a chart pattern formed by two converging trend lines connecting a series of sequential peaks and troughs. These two lines result in the formation of a triangle that appears to be symmetrical.
A symmetrical triangle pattern is usually formed when there is indecision in the price movements and there is uncertainty among the buyers and sellers. This chart pattern represents a period of consolidation before the price breaks out or breaks down. In case a breakout occurs from the upper trend line, it is a strong bullish indication as it signifies the start of a new bullish trend.
Buy Level(s): The stock has currently broken out of a symmetrical triangle pattern. However, the ideal buy level for ZIM is if the stock closes above the immediate resistance level of $13.50. This is marked in the chart below as a green color dotted line.
Daily chart – ZIM

ZIM – Symmetrical Triangle Pattern Breakout
#4 TripAdvisor Inc. (NASDAQ: TRIP)
Sector: Consumer Cyclical • Travel Services
Reason: Breakout From a Flag Pattern
A flag pattern is a short-term continuation pattern that marks a small consolidation before the previous move resumes. The pattern is formed when the market consolidates in a narrow range after a sharp move. For a stock in an uptrend, a breakout from this pattern is typically a strong bullish indication.
Buy Level(s): Although the stock has currently broken out of the flag pattern, the ideal buy level for TRIP is above the near-term resistance level of $27.80. This is marked in the chart below as a green color dotted line.
Daily chart – TRIP
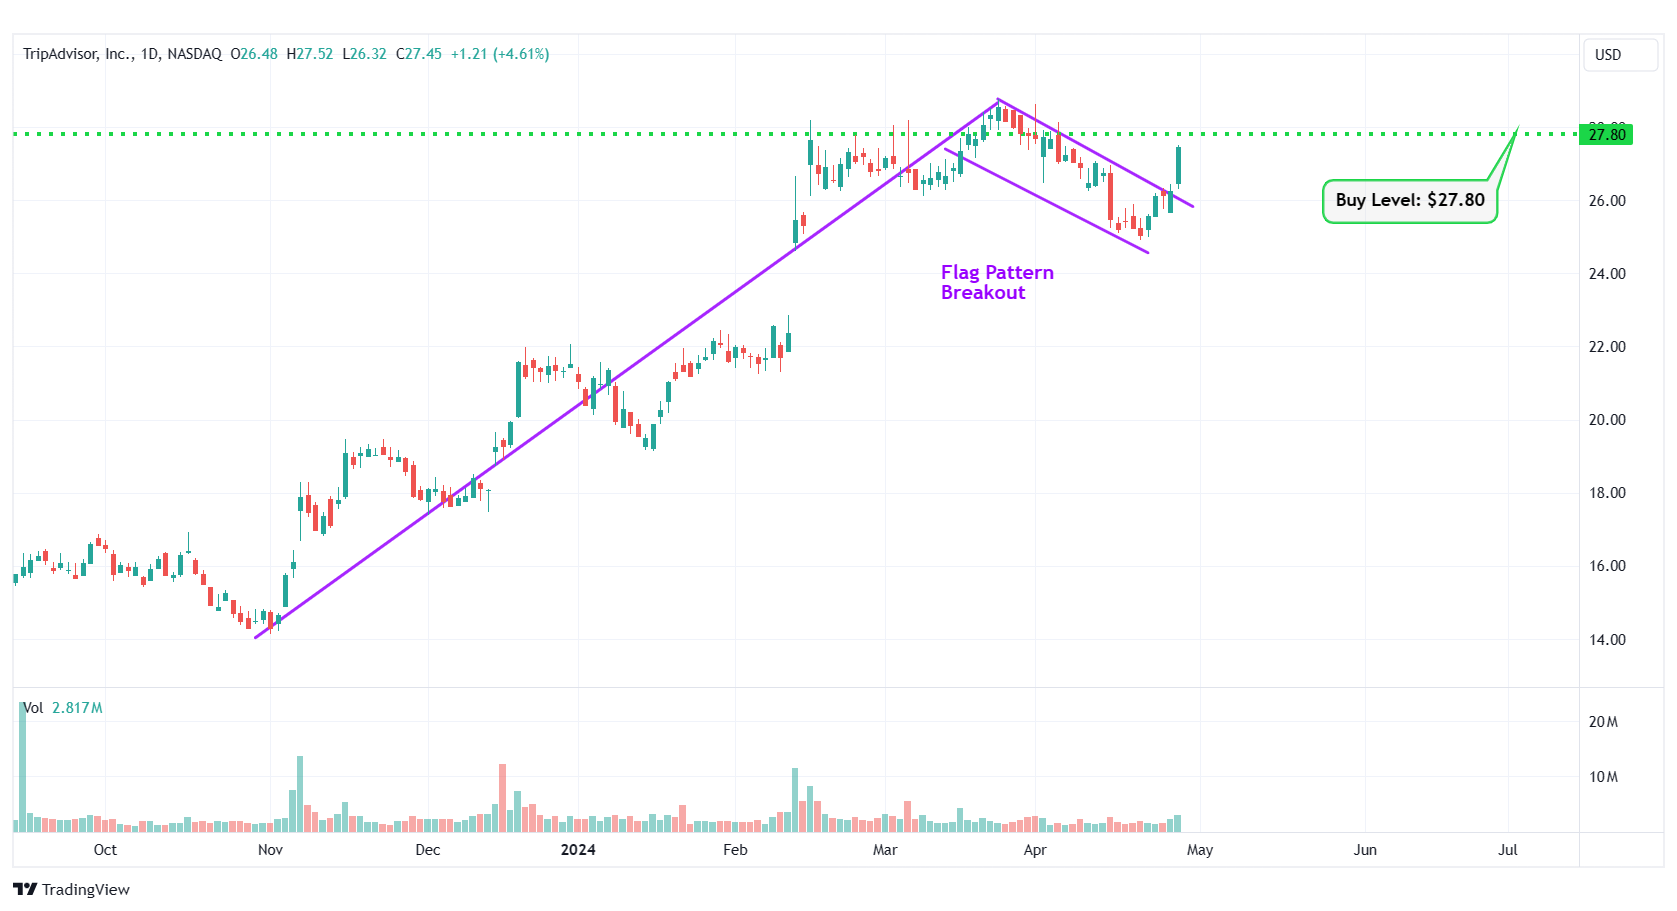
TRIP – Flag Pattern Breakout
#5 Koninklijke Philips N.V. ADR (NYSE: PHG)
Sector: Healthcare • Medical Devices
Reason: Symmetrical Triangle Pattern Breakout
A symmetrical triangle is a chart pattern formed by two converging trend lines connecting a series of sequential peaks and troughs. These two lines result in the formation of a triangle that appears to be symmetrical.
A symmetrical triangle pattern is usually formed when there is indecision in the price movements and there is uncertainty among the buyers and sellers. This chart pattern represents a period of consolidation before the price breaks out or breaks down. In case a breakout occurs from the upper trend line, it is a strong bullish indication as it signifies the start of a new bullish trend.
Buy Level(s): The stock has currently broken out of a symmetrical triangle pattern. However, the ideal buy level for PHG is if the stock closes above the immediate resistance level of $21.50. This is marked in the chart below as a green color dotted line.
Daily chart – PHG
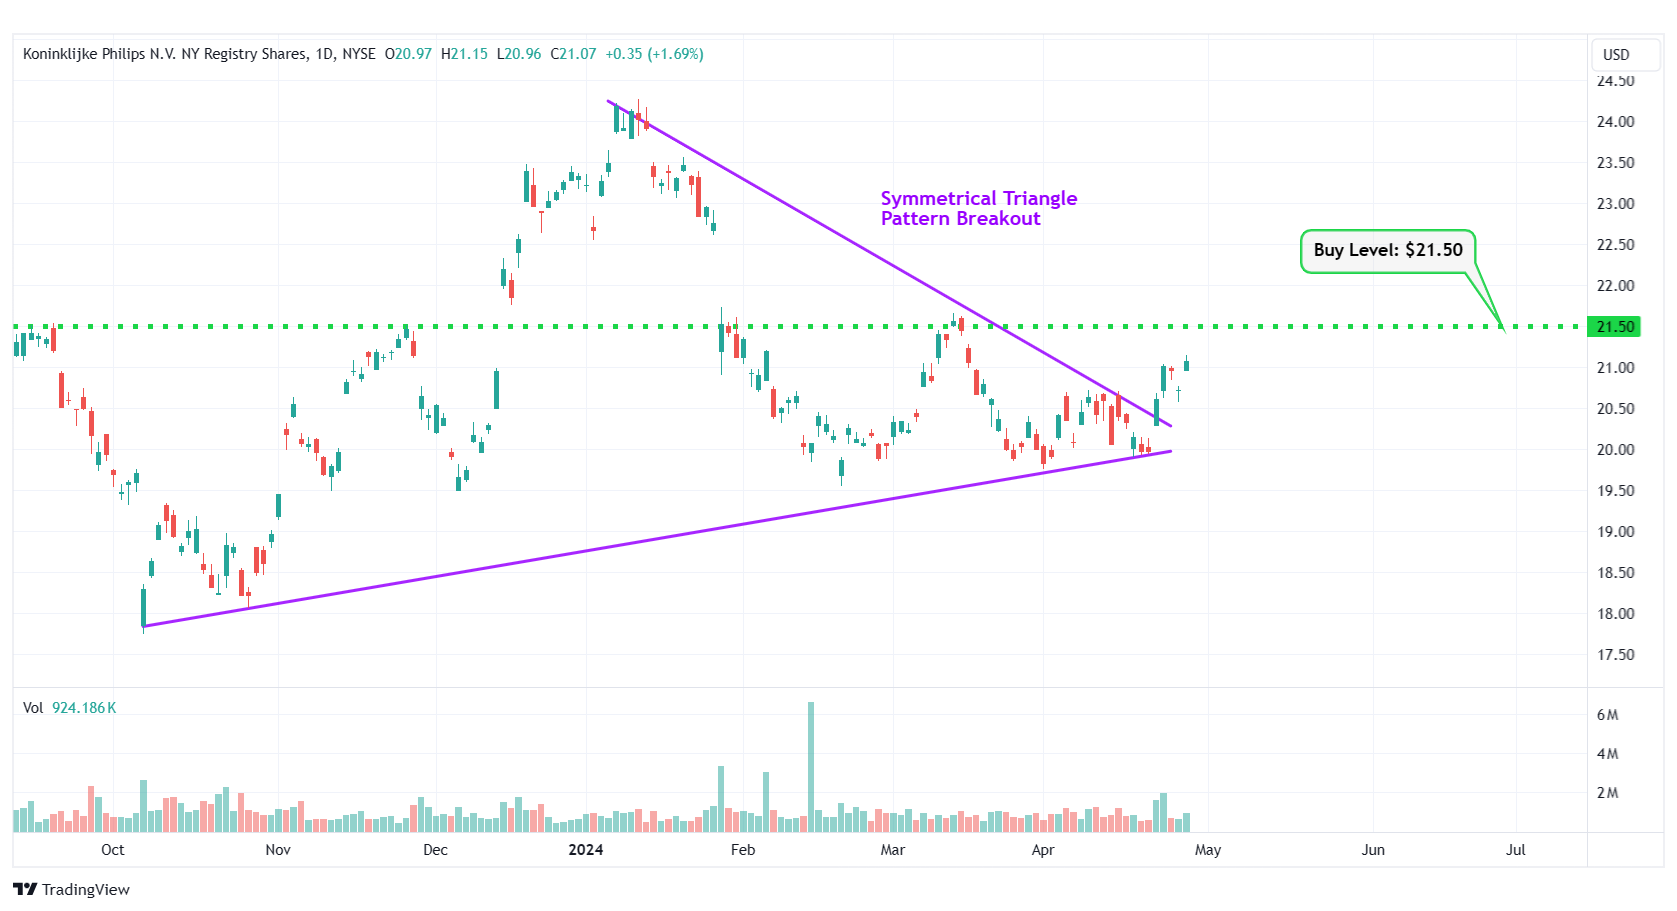
PHG – Symmetrical Triangle Pattern Breakout
#6 Fulton Financial Corp. (NASDAQ: FULT)
Sector: Financial • Banks – Regional
Reason: Formation of a Downtrend Channel
A downtrend or descending channel is the price action contained between downward sloping parallel lines. It is formed by two lines that are drawn by connecting the lower highs and lower lows of a stock’s price. Even though this is typically a bearish pattern, a breakout from the upper rail of this pattern is considered a good bullish indication.
Buy Level(s): The daily chart shows that the stock is currently forming a downtrend channel. The ideal buy level for FULT is if the stock breaks out of the downtrend channel and has a daily close above $16.00. This is marked in the chart below as a green color dotted line.
Daily chart – FULT

FULT – Downtrend Channel
#7 U.S. Silica Holdings Inc. (NYSE: SLCA)
Sector: Energy • Oil & Gas Equipment & Services
Reason: Symmetrical Triangle Pattern Breakout
A symmetrical triangle is a chart pattern formed by two converging trend lines connecting a series of sequential peaks and troughs. These two lines result in the formation of a triangle that appears to be symmetrical.
A symmetrical triangle pattern is usually formed when there is indecision in the price movements and there is uncertainty among the buyers and sellers. This chart pattern represents a period of consolidation before the price breaks out or breaks down. In case a breakout occurs from the upper trend line, it is a strong bullish indication as it signifies the start of a new bullish trend.
Buy Level(s): The stock has currently broken out of a symmetrical triangle pattern. However, the ideal buy level for SLCA is if the stock closes above the immediate resistance level of $16.10. This is marked in the chart below as a green color dotted line.
Daily chart – SLCA

SLCA – Symmetrical Triangle Pattern Breakout
#8 Gamestop Corporation (NYSE: GME)
Sector: Consumer Cyclical • Specialty Retail
Reason: Formation of a Falling Wedge Pattern
A falling wedge pattern is formed by joining two downward-sloping, converging trendlines having a contracting range. The pattern appears to be wide at the top and continues to contract as prices fall. A breakout from a falling wedge pattern can indicate either reversal or continuation depending on where the pattern appeared in the trend.
A stock that has broken out of a falling wedge pattern would have gained momentum and would have the potential to move higher.
Buy Level(s): The ideal buy level for GME is if the stock breaks out of the falling wedge pattern, at a price of around $12.50. This is marked in the chart below as a green color dotted line.
Daily chart – GME

GME – Falling Wedge Pattern
#9 Viking Therapeutics Inc. (NASDAQ: VKTX)
Sector: Healthcare • Biotechnology
Reason: Symmetrical Triangle Pattern Breakout
A symmetrical triangle is a chart pattern formed by two converging trend lines connecting a series of sequential peaks and troughs. These two lines result in the formation of a triangle that appears to be symmetrical.
A symmetrical triangle pattern is usually formed when there is indecision in the price movements and there is uncertainty among the buyers and sellers. This chart pattern represents a period of consolidation before the price breaks out or breaks down. In case a breakout occurs from the upper trend line, it is a strong bullish indication as it signifies the start of a new bullish trend.
Buy Level(s): The stock has currently broken out of a symmetrical triangle pattern. However, the ideal buy level for VKTX is if the stock closes above the immediate resistance level of $77.00. This is marked in the chart below as a green color dotted line.
Daily chart – VKTX
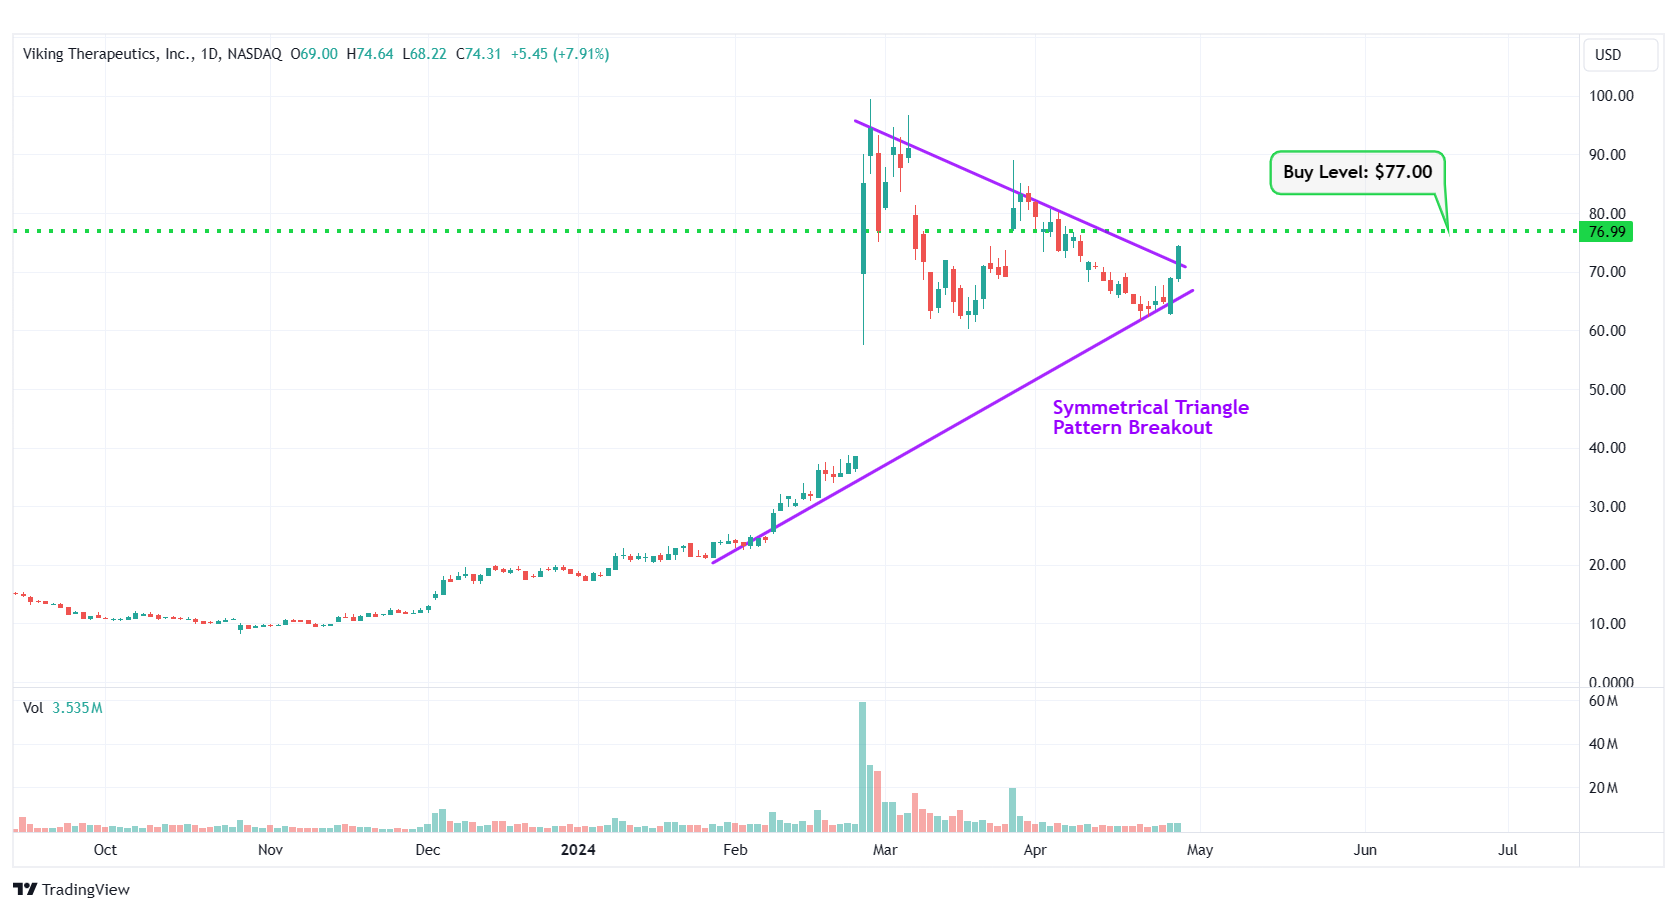
VKTX – Symmetrical Triangle Pattern Breakout
#10 Resmed Inc. (NYSE: RMD)
Sector: Healthcare • Medical Instruments & Supplies
Reason: Symmetrical Triangle Pattern Breakout
A symmetrical triangle is a chart pattern formed by two converging trend lines connecting a series of sequential peaks and troughs. These two lines result in the formation of a triangle that appears to be symmetrical.
A symmetrical triangle pattern is usually formed when there is indecision in the price movements and there is uncertainty among the buyers and sellers. This chart pattern represents a period of consolidation before the price breaks out or breaks down. In case a breakout occurs from the upper trend line, it is a strong bullish indication as it signifies the start of a new bullish trend.
Buy Level(s): The stock has currently broken out of a symmetrical triangle pattern. However, the ideal buy level for RMD is if the stock closes above the immediate resistance level of $223.00. This is marked in the chart below as a green color dotted line.
Daily chart – RMD
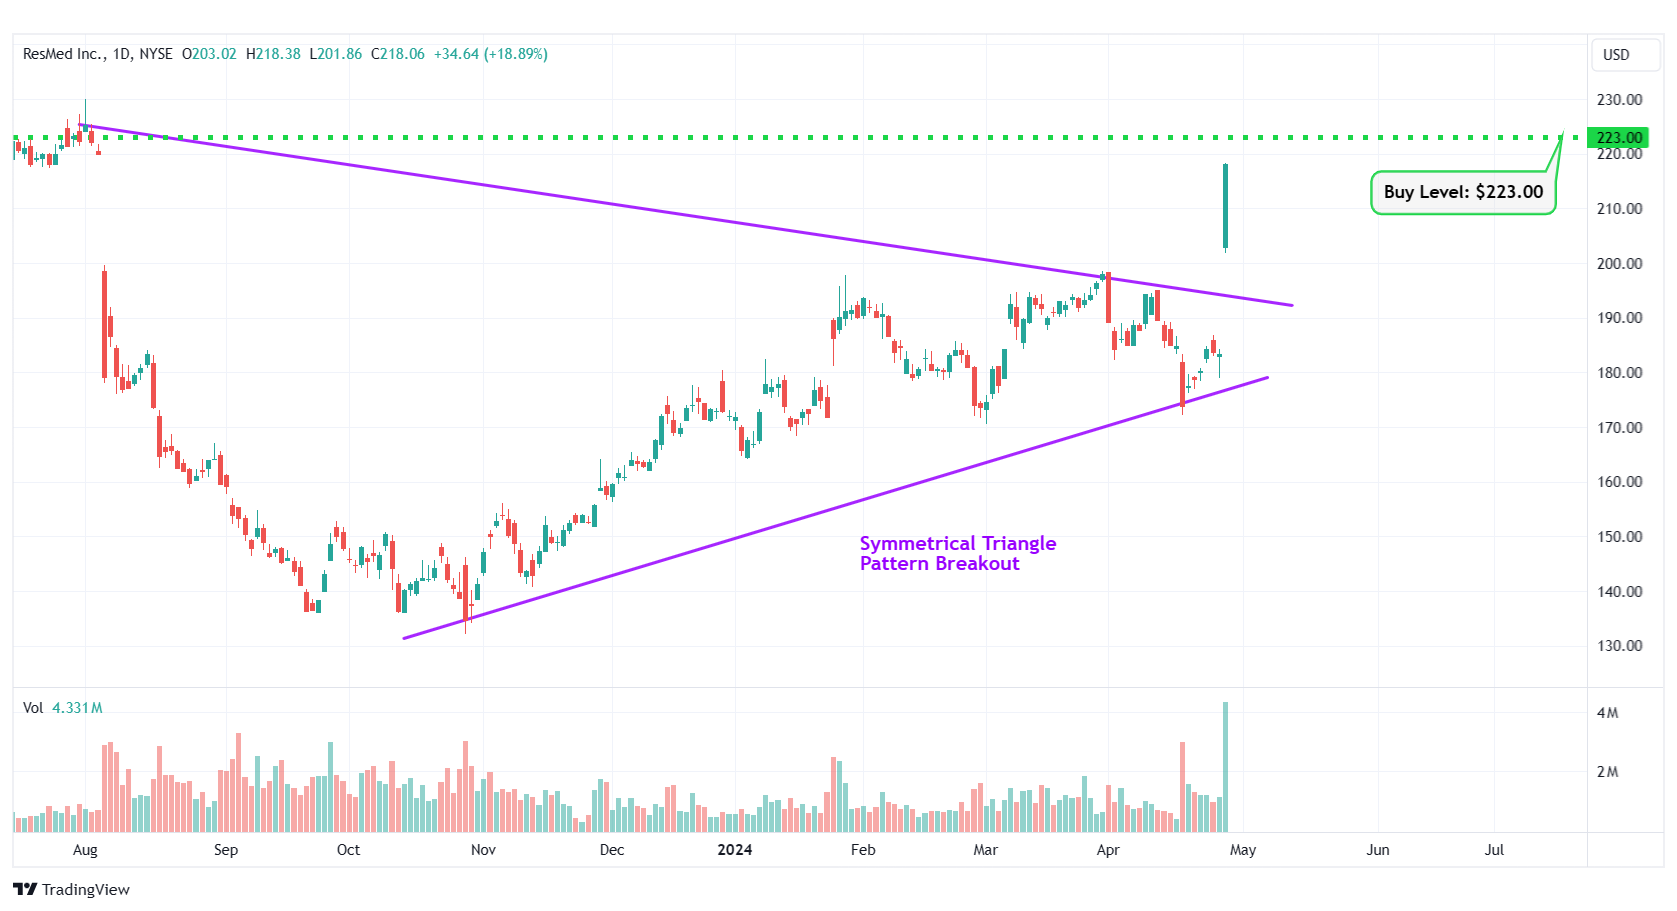
RMD – Symmetrical Triangle Pattern Breakout
Happy Trading!
Trades of The Day Research Team
Everyone wants to know when to buy, sell, or hold a stock. FAST Graphs reveals this by clearly illustrating the value of the business relative to its stock price. Get 25% off using Daily Trade Alert's special referral link and coupon code AFFILIATE25
Source: Trades of the Day
