
Some so-called market experts treat “technical analysis” like dirty words.
They claim using it is like trying to read tea leaves.
They say it’s just a bunch of squiggly lines.
Warren Buffett once famously said, “I realized that technical analysis didn’t work when I turned the chart upside down and didn’t get a different answer.”
I’m sorry to tell you… but Warren doesn’t understand or use technical analysis because he buys companies… not stocks.
Technical analysis matters. And more often than most people realize, it matters a lot.
Like right now.
The markets are struggling to find direction. There are almost equally balanced headwinds and tailwinds buffeting investors.
The most basic technical analysis tools – including trend channels and support and resistance levels – are especially key now.
So I want to share some insight on what they are and how I use them.
Those squiggly lines on charts?
They are the prices at which buyers and sellers transacted. They are decision points. They are sentiment and psychology data points, reflections of fear and greed.
Some analysts say price points have nothing to do with earnings or fundamentals or any metrics that matter.
I – and everyone else who uses technical analysis – will tell you that all those metrics are actually factored into the price of a stock (or the price level of the market, when talking about indexes).
Capital moves markets… but psychology moves capital.
That psychology is evident in the prices traders and investors transact at.
Trend channels show us the prevailing direction of a stock or the market.
Is the stock or the market in an uptrend or a downtrend?
How long or short is the trend?
Channels show us what investors are doing, what they’re thinking… and whether they are positive or negative about a stock or the market.
Breaking out of a well-defined channel, in the opposite direction of the trend, can be an indication of a change in psychology or sentiment.
That’s why channels are important.
Support and resistance levels show where psychology and sentiment are being tested.
When an asset’s price falls down to a support level (a horizontal line connecting similar price levels), traders and investors look at that support as a price level where buyers had come in before, when they were bullish.
Support can be where more buyers come in, having seen that buyers have come in at that level before.
But support can be broken. And when that happens – especially if it’s broken meaningfully – traders and investors who own the asset might think there must be good reasons for the sell-off. They will then sell out themselves to capture any profits… or stem any losses.
Resistance levels, like support levels, are expressed as horizontal lines connecting similar price levels. But resistance levels are drawn above where the asset is trading. Reaching a resistance level and piercing through it is a bullish signal. It shows there are other traders and investors paying up and pushing the asset through what was previously resistance.
But resistance is often a level where traders and investors hesitate to commit more capital. If an asset gets to resistance, can’t break through and then sells off… it’s a sign bullish sentiment may be waning or bearish sentiment may be emerging.
Here’s what the S&P 500 looks like with channels and current support and resistance levels drawn.
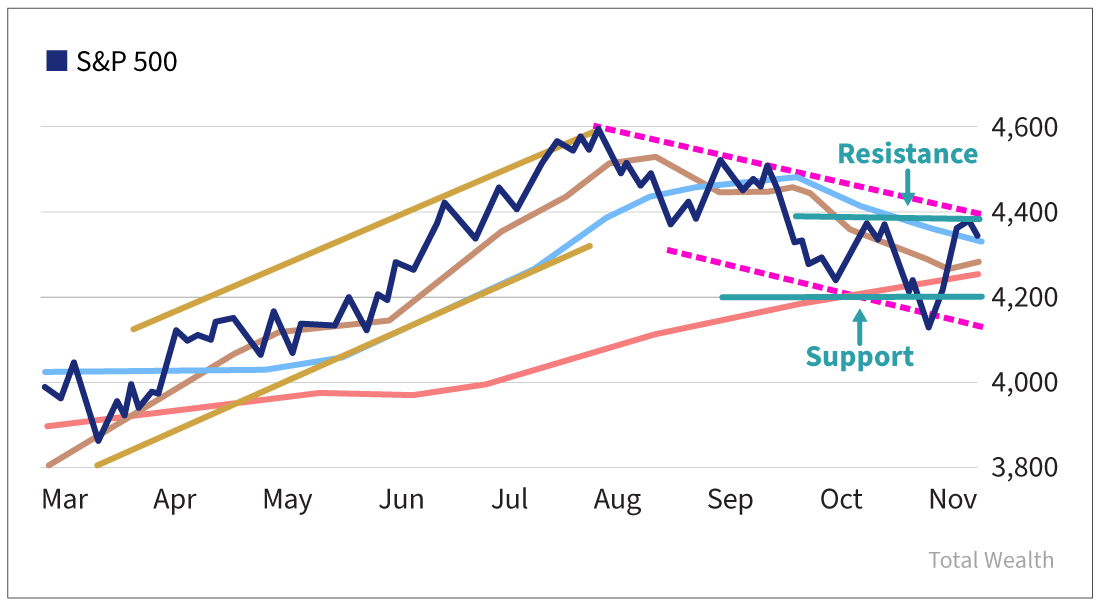 The left side of the chart shows the bullish trend channel (in gold) that stocks were in. It’s the first leg of a new bull market.
The pink channel markers on the right side of the chart show the downtrend we’re in now.
While we’ve turned down, the low point of the breakdown is only about 10% from the highs the S&P 500 hit in July. That’s a correction. If we were to go down 20% from the July highs, we would be in a bear market.
But we’re nowhere near there now.
I’ve also labeled in teal on the right portion of the graph two horizontal lines that show support and resistance. Support is at 4,200, and resistance is at 4,400.
Here’s what you need to understand…
Since the market is trying to move higher, what happens when it gets to resistance is key.
If we break through resistance and can stay near there, even if we dip back a little below resistance, then the market could rally into year-end.
On the other hand, if we get to resistance or near there and stocks turn south – especially if they drop by 3% to 5% – the rally could be out of steam. We could head back down and test support.
Keep an eye on where the S&P 500 goes… and what it does when it gets to resistance or support.
If it breaks higher out of the channel, that would be bullish.
Breaking down through the red line marking the 200-day moving average would be bad. Breaking through support at 4,200 would be worse. And diving below the lower down trending channel marker would mean real pain.
We don’t know which way the market will head… yet.
But now you have the tools to prepare.
Cheers,
Shah
The company manufacturing Nvidia's AI servers trades under a secret name. AI revenue: $30B this year. Stock price: $8. Click for the hidden identity →
Source: Total Wealth Research
