
NIKE, Inc. (NYSE: NKE) seems to be poised for a price surge as per its latest charts. The company designs, develops, markets, and sells men’s, women’s, and kids athletic footwear, apparel, equipment, and accessories worldwide.
The company provides athletic and casual footwear, apparel, and accessories under the Jumpman trademark; and casual sneakers, apparel, and accessories under the Converse, Chuck Taylor, All Star, One Star, Star Chevron, and Jack Purcell trademarks.
Bullish Indications
#1 Symmetrical Triangle Breakout: The daily chart shows that the stock had recently formed a Symmetrical Triangle pattern. This is a continuation pattern and is characterized by two converging trend lines connecting a series of sequential peaks and troughs. This pattern is marked on the daily chart as pink color lines. The breakout from a symmetrical triangle pattern usually signifies a bullish move. Currently, the stock has broken out of the symmetrical triangle pattern which is a possible bullish sign.
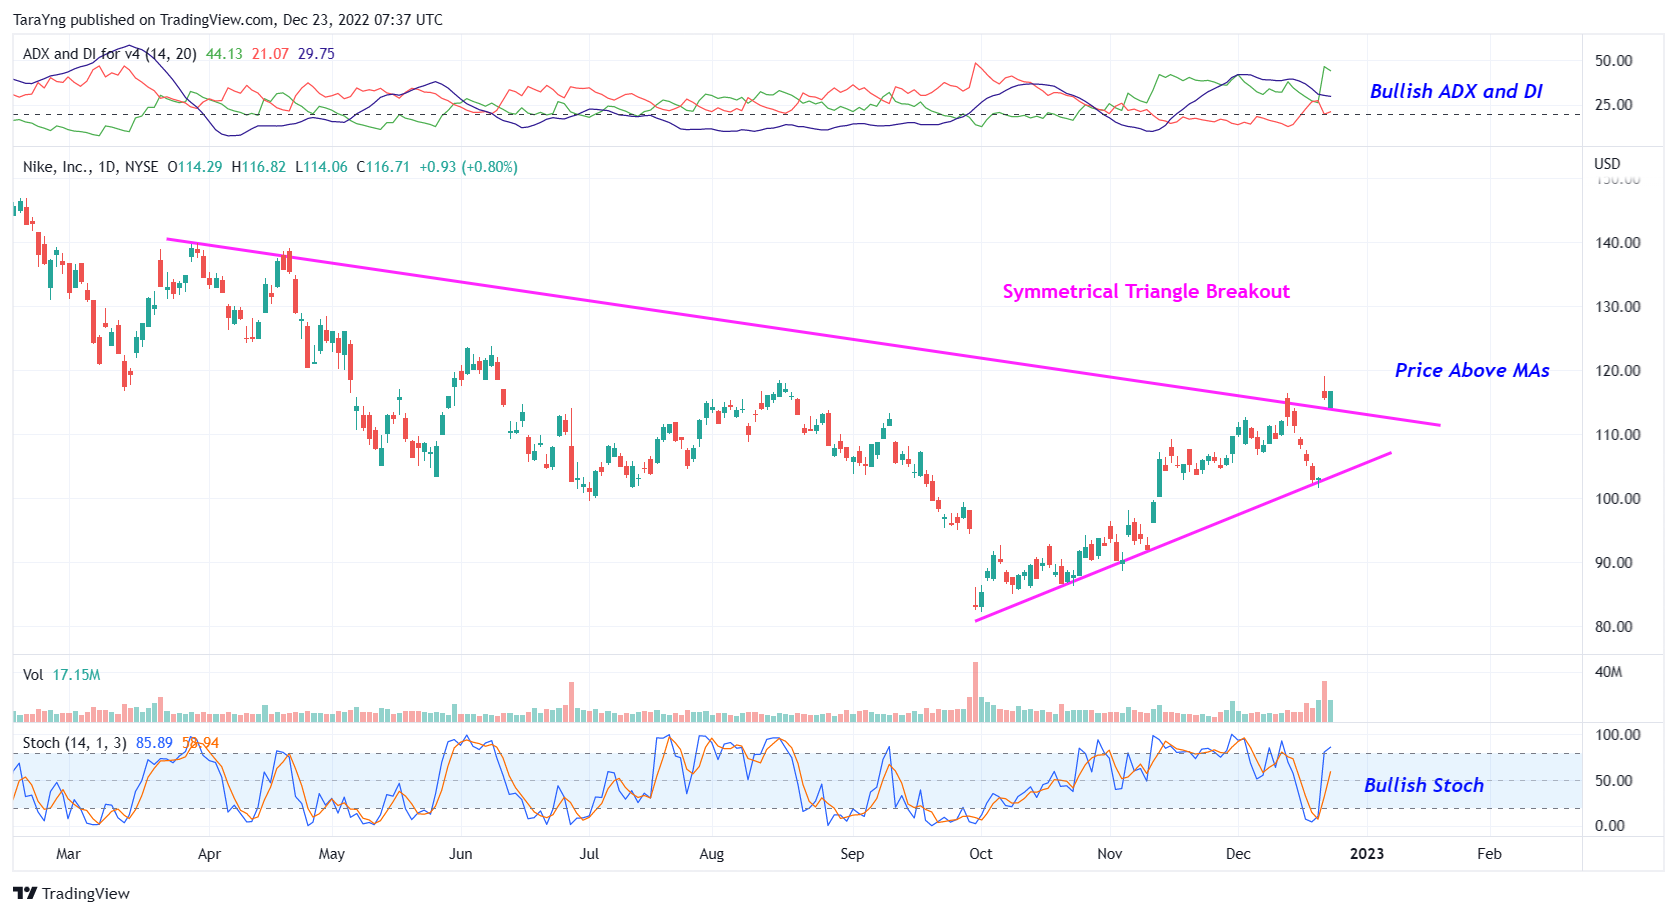
NKE – Daily Chart
#2 Price above MAs: The price is currently above the short-term moving average of 50-day SMA as well as the longer-term moving average of 200-day SMA, indicating that the bulls are still in control. This is a positive indication.
#3 Bullish ADX: The ADX indicator shows that the +DI line is currently above the –DI line and the ADX line has started to move up from below the –DI and +DI lines. This indicates possible bullishness.
#4 Bullish Stoch: The %K line is above the %D line of the stochastic in the daily chart, indicating possible bullishness.
#5 Downtrend Channel Breakout: As you can see from the weekly chart, the stock has been trading within a downtrend channel during the past few weeks. This is marked in the weekly chart in purple color. Currently, the stock has broken out of the downtrend channel. Once the stock breaks out from a downtrend channel, it has the potential to move further up.
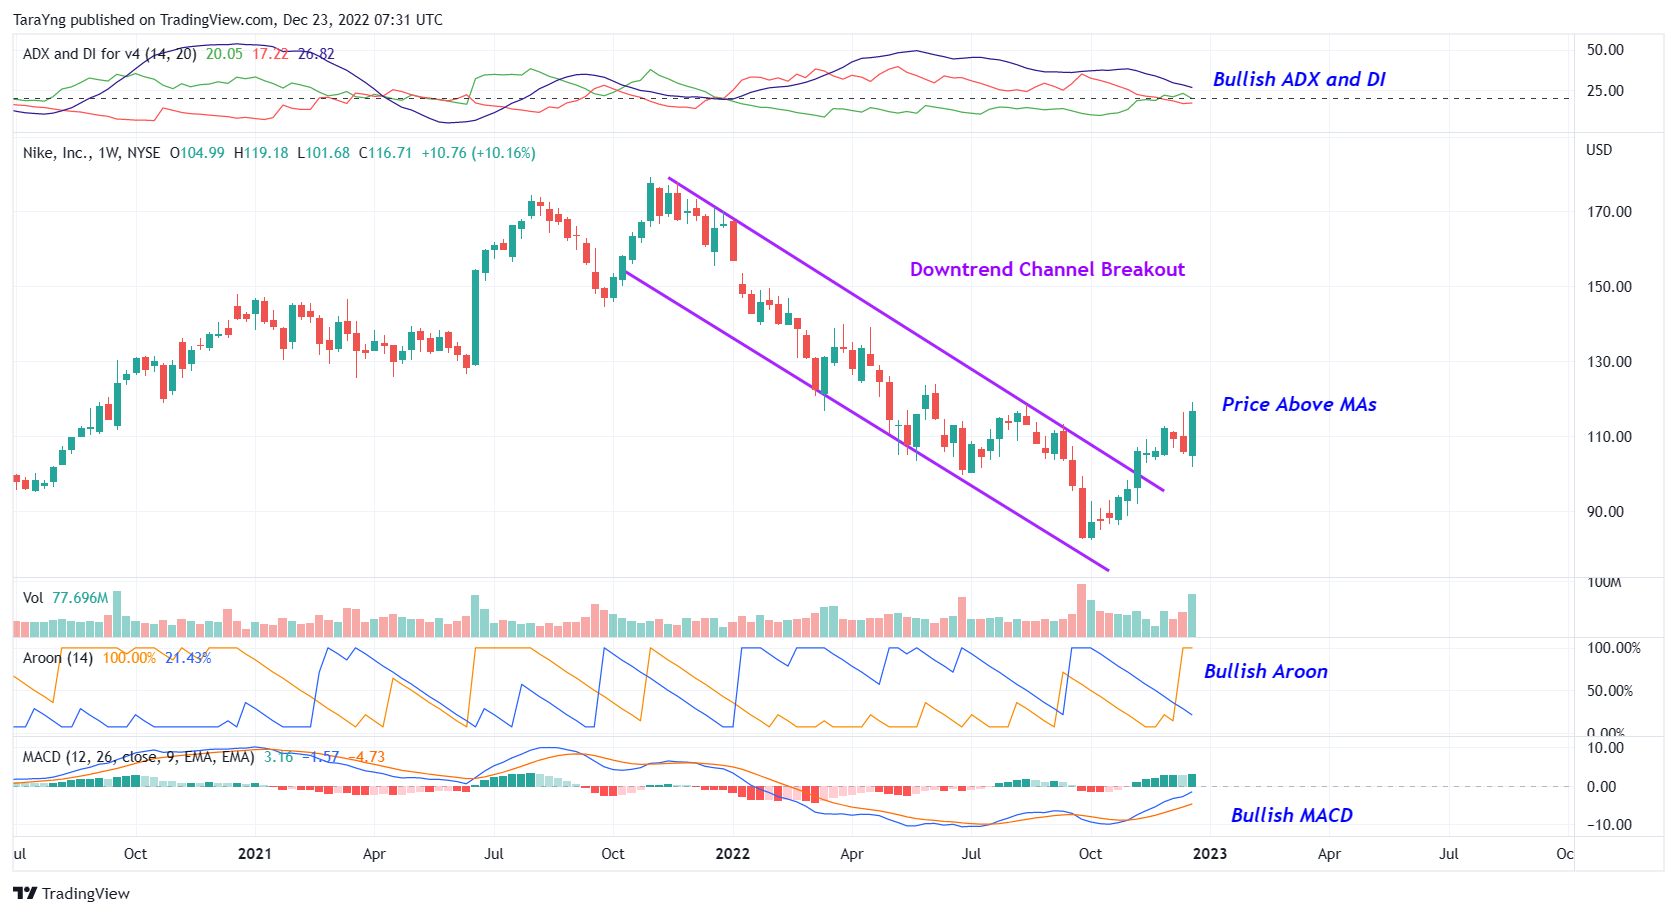
NKE – Weekly Chart
#6 Bullish Aroon: The value of Aroon Up (orange line) is above 70 while Aroon Down (blue line) is below 30 in the weekly chart. This indicates possible bullishness.
#7 Bullish MACD: The MACD line is above the MACD signal line in the weekly chart as well, indicating bullishness.
Recommended Trade (based on the charts)
Buy Levels: If you want to get in on this trade, you can purchase the shares of NKE above the price of around $117.30.
TP: Our target prices are $127 and $134 in the next 3-6 months.
SL: To limit risk, place stop-loss below $112.00. Note that the stop-loss is on a closing basis.
Our target potential upside is 8% to 14% in the next 3 to 6 months.
For a risk of $5.30, our target rewards are $9.70 and $16.70. This is a nearly 1:2 and 1:3 risk-reward trade.
In other words, this trade offers nearly 2x to 3x more potential upside than downside.
Risks to Consider
The stock may reverse its overall trend if it breaks down from the trend channel with a high volume. The sell-off of the stock could also be triggered in case of any negative news, overall weakness in the market, or any regulatory changes in the sector.
Happy Trading!
Tara
Motley Fool Stock Advisor's average stock pick is up over 350%*, beating the market by an incredible 4-1 margin. Here’s what you get if you join up with us today: Two new stock recommendations each month. A short list of Best Buys Now. Stocks we feel present the most timely buying opportunity, so you know what to focus on today. There's so much more, including a membership-fee-back guarantee. New members can join today for only $99/year.
Source: Trades of the Day
