
Picking a winning trade on a consistent basis is not simply a stroke of luck. It’s the result of calculated screening, planning, and deliberation.
With this in mind, we have started a new weekly series on our top 10 stocks to watch this week — stocks that look poised for a possible breakout in the coming days. Traders should add these stocks to their watchlist now.
The Top 10 Stocks to Watch This Week for Possible Breakouts
| Sl # | Name of the Stock | Stock Ticker | Last Close | Buy Level(s) | Reason |
| 1 | CarGurus, Inc. | NASDAQ: CARG | $14.19 | $15.50 | Falling Wedge Pattern |
| 2 | Freeport-McMoRan Inc. | NYSE: FCX | $35.19 | $36.20 | Symmetrical Triangle Pattern Breakout |
| 3 | ING Groep N.V. | NYSE: ING | $10.84 | $11.40 | Consolidation Area |
| 4 | Allscripts Healthcare Solutions, Inc. | NASDAQ: MDRX | $15.67 | $16.00 | Falling Wedge Pattern Breakout |
| 5 | General Electric Company | NYSE: GE | $81.07 | $81.40 | Double Bottom Pattern |
| 6 | Citizens Financial Group, Inc. | NYSE: CFG | $40.12 | $41.00 | Falling Wedge Pattern Breakout |
| 7 | Robinhood Markets, Inc. | NASDAQ: HOOD | $12.28 | $12.40 | Symmetrical Triangle Pattern Breakout |
| 8 | NerdWallet, Inc. | NASDAQ: NRDS | $13.27 | $13.80 | Breakout From Consolidation Area |
| 9 | Micron Technology, Inc. | NASDAQ: MU | $53.16 | $58.20 | Falling Wedge Pattern Breakout |
| 10 | Valley National Bancorp | NASDAQ: VLY | $12.11 | $12.20 | Symmetrical Triangle Pattern |
Important: Typically, these trades offer a risk: reward ratio of 1:2 or 1:3 in the next 6 months, which implies 2x to 3x rewards when compared to risks. So, be sure to set your stop-loss levels and target prices accordingly to manage your risk. In addition, these trade ideas are triggered using daily closing prices, not intra-day pricing. So, if you participate in these trades, make sure that you only buy the stock once its daily close is above the recommended price level.
That said, here are the top 10 stocks to watch for a breakout, in no particular order.
#1 CarGurus, Inc. (NASDAQ: CARG)
Sector: Communication Services | Internet Content & Information
Reason: Formation of a Falling Wedge Pattern
A falling wedge pattern is formed by joining two downward-sloping, converging trendlines having a contracting range. The pattern appears to be wide at the top and continues to contract as prices fall. A breakout from a falling wedge pattern can indicate either reversal or continuation depending on where the pattern appeared in the trend.
A stock that has broken out of a falling wedge pattern would have gained momentum and would have the potential to move higher.
Buy Level(s): The ideal buy level for CARG is if the stock breaks out of the falling wedge pattern, at a price of around $15.50. This is marked in the chart below as a green color dotted line.
Daily chart – CARG
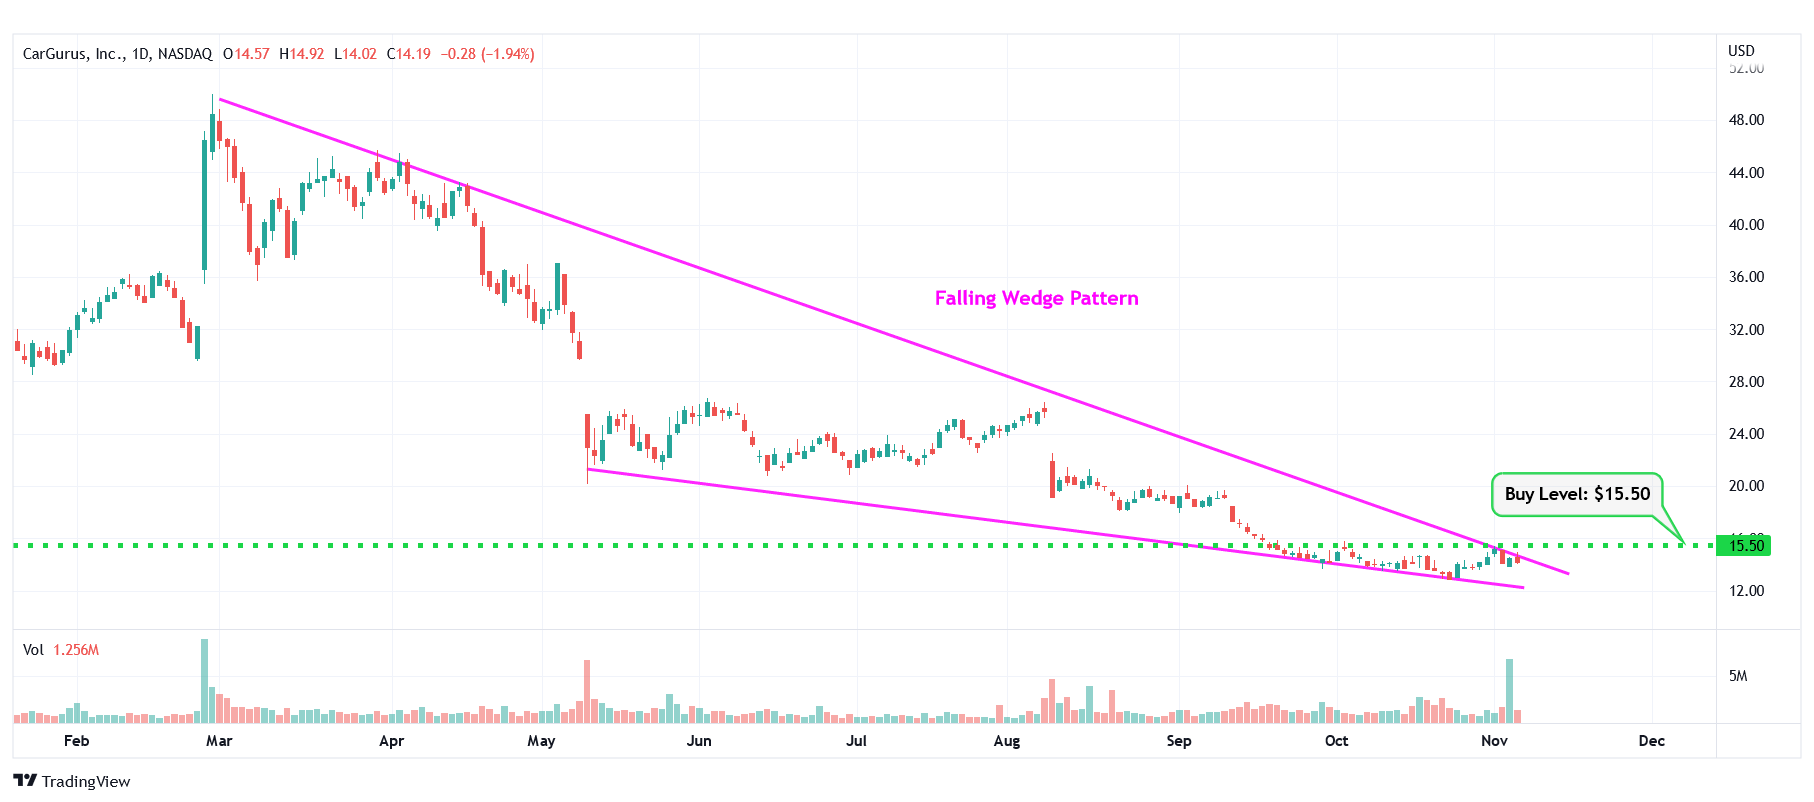
CARG – Falling Wedge Pattern
#2 Freeport-McMoRan Inc. (NYSE: FCX)
Sector: Basic Materials | Copper
Reason: Symmetrical Triangle Pattern Breakout
A symmetrical triangle is a chart pattern formed by two converging trend lines connecting a series of sequential peaks and troughs. These two lines result in the formation of a triangle that appears to be symmetrical.
A symmetrical triangle pattern is usually formed when there is indecision in the price movements and there is uncertainty among the buyers and sellers. This chart pattern represents a period of consolidation before the price breaks out or breaks down. In case a breakout occurs from the upper trend line, it is a strong bullish indication as it signifies the start of a new bullish trend.
Buy Level(s): The stock has currently broken out of a symmetrical triangle pattern. However, the ideal buy level for FCX is if the stock closes above the immediate resistance level of $36.20. This is marked in the chart below as a green color dotted line.
Daily chart – FCX
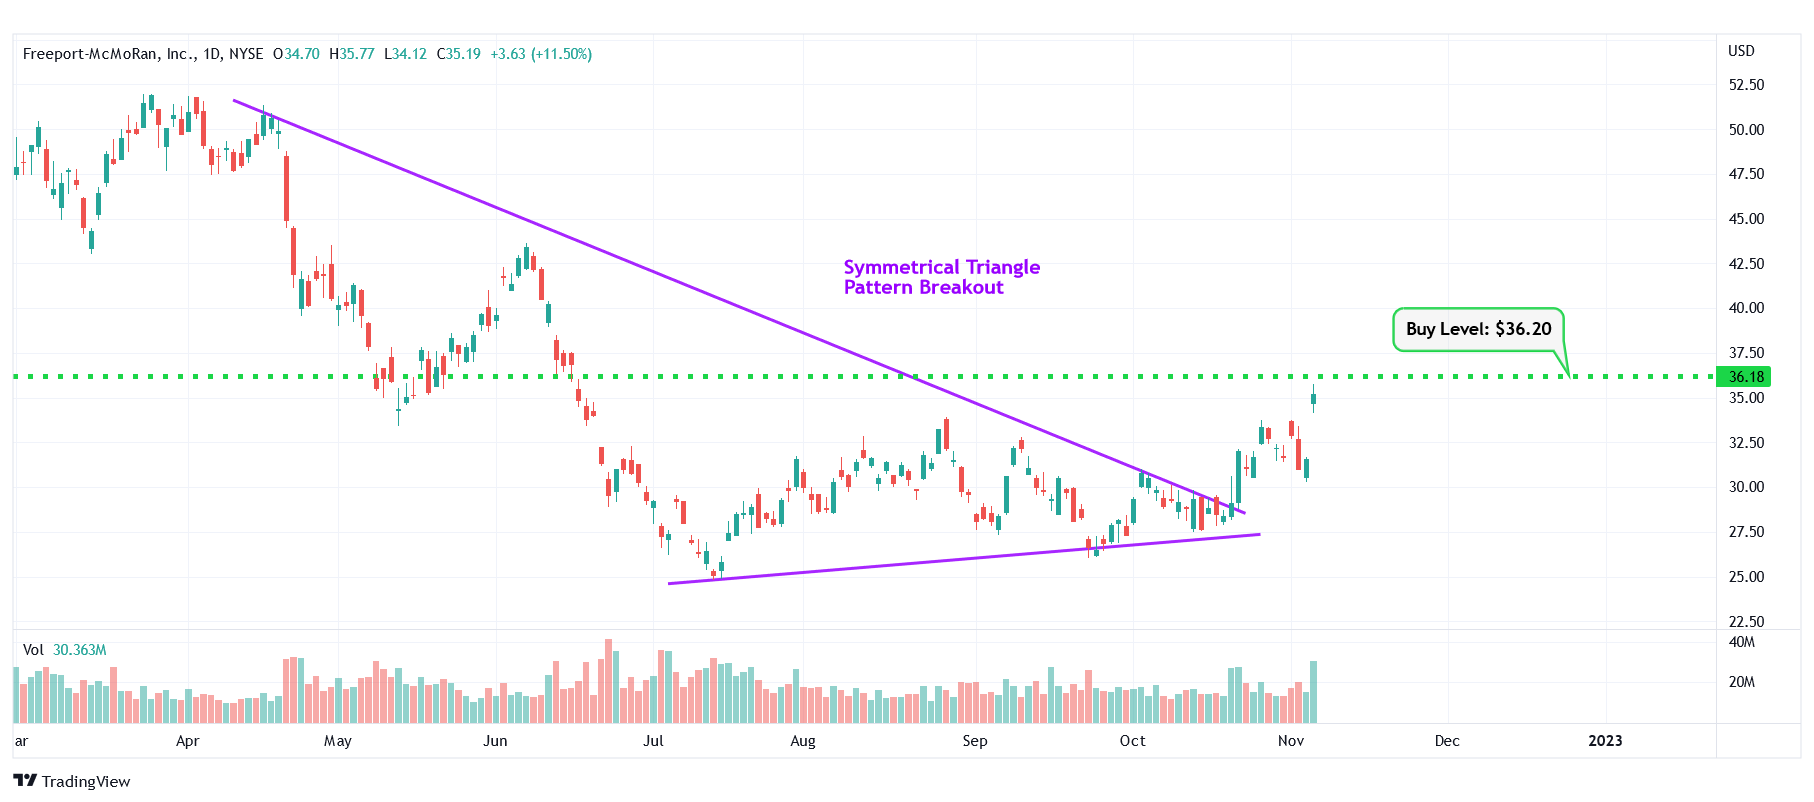
FCX – Symmetrical Triangle Pattern Breakout
#3 ING Groep N.V. (NYSE: ING)
Sector: Financial | Banks – Diversified
Reason: Formation of a Consolidation Area
A Consolidation Area is a price action contained between two parallel lines. It is formed by a lower line that connects the lows, and an upper line that joins the highs. A stock usually trades between the two lines of the consolidation area before finally breaking out from the upper rail.
Buy Level(s): The ideal buy level for ING is above the breakout level of the consolidation area, at around $11.40. This is marked in the chart below as a green color dotted line.
Daily chart – ING
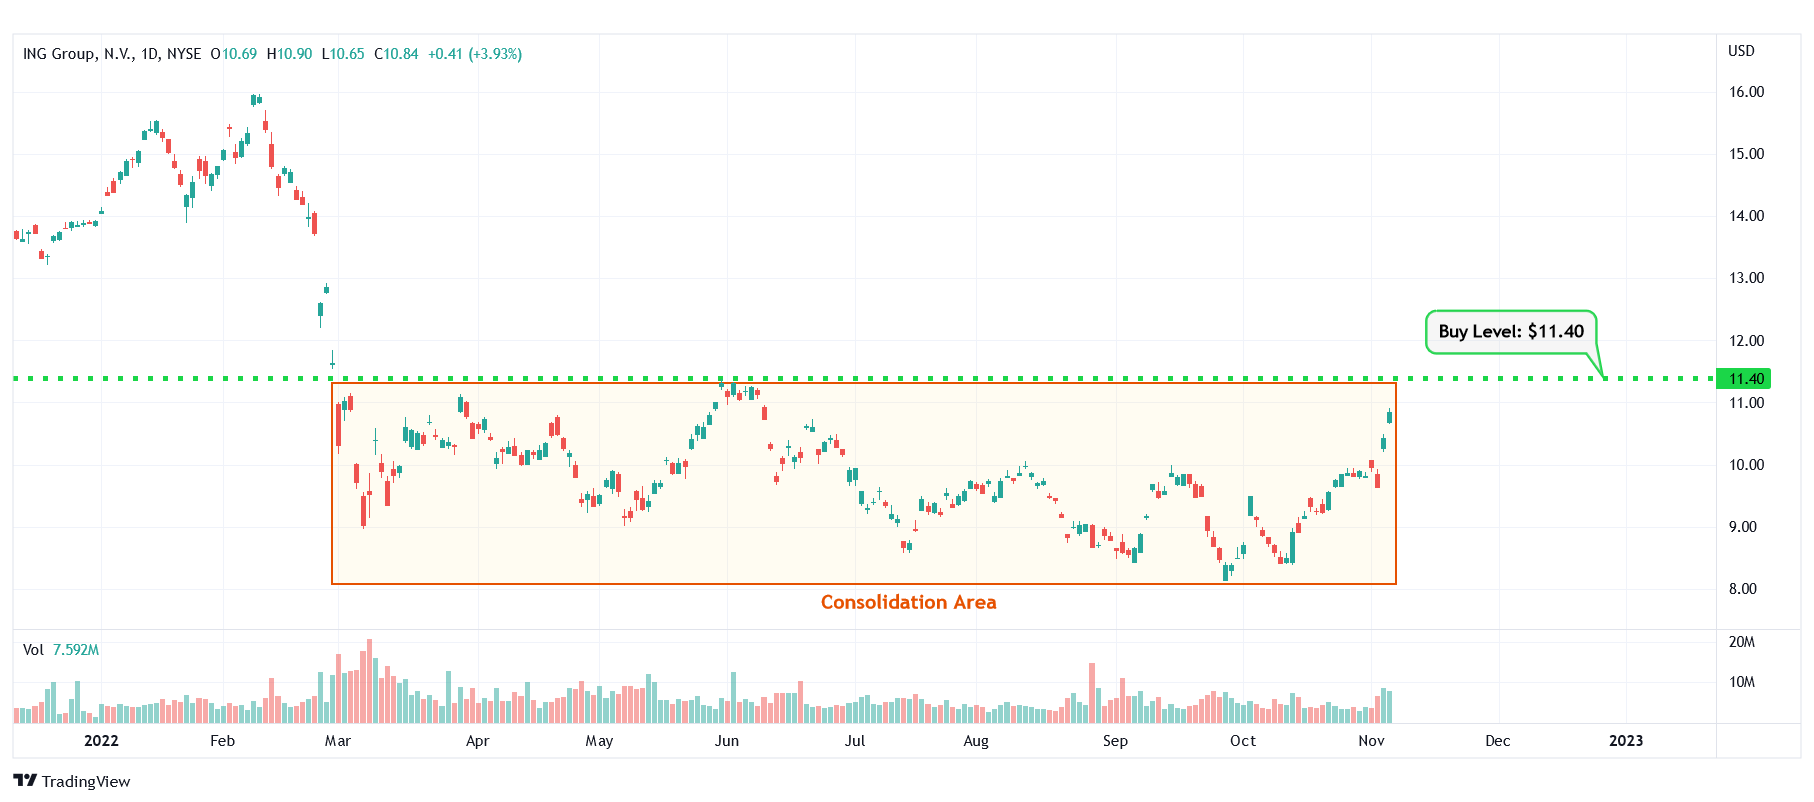
ING – Consolidation Area
#4 Allscripts Healthcare Solutions, Inc. (NASDAQ: MDRX)
Sector: Healthcare | Health Information Services
Reason: Falling Wedge Pattern Breakout
A falling wedge pattern is formed by joining two downward-sloping, converging trendlines having a contracting range. The pattern appears to be wide at the top and continues to contract as prices fall. A breakout from a falling wedge pattern can indicate either reversal or continuation depending on where the pattern appeared in the trend.
A stock that has broken out of a falling wedge pattern would have gained momentum and would have the potential to move higher.
Buy Level(s): The stock has currently broken out of a falling wedge pattern. However, the ideal buy level for MDRX is above the nearest resistance level of $16.00. This is marked in the chart below as a green color dotted line.
Daily chart – MDRX
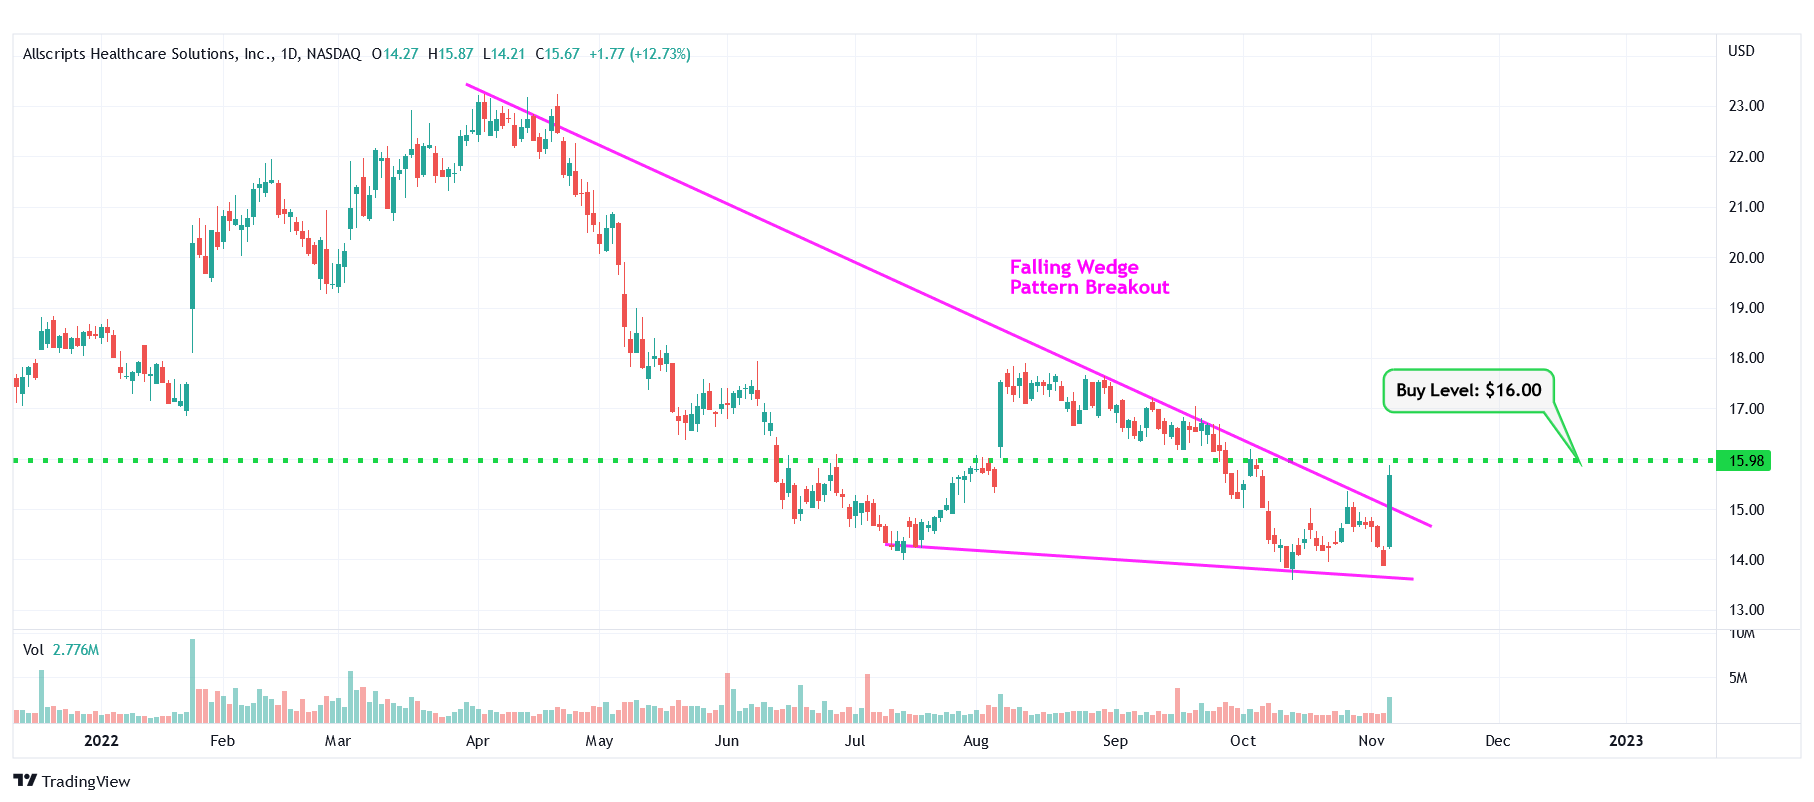
MDRX – Falling Wedge Pattern Breakout
#5 General Electric Company (NYSE: GE)
Sector: Industrials | Specialty Industrial Machinery
Reason: Formation Of A Double Bottom Pattern
A Double Bottom Pattern looks like the letter W and is characterized by two well-defined lows at approximately the same price level. This twice-touched low is usually a very strong support level. The high point between the two bottoms’ resistance level is called a neckline. Once a breakout happens from this key price level (neckline), it signifies the start of a bullish move.
Buy Level(s): The ideal buy level for GE is above the breakout level of the double bottom pattern at around $81.40. This is marked in the chart below as a green color dotted line.
Daily chart – GE
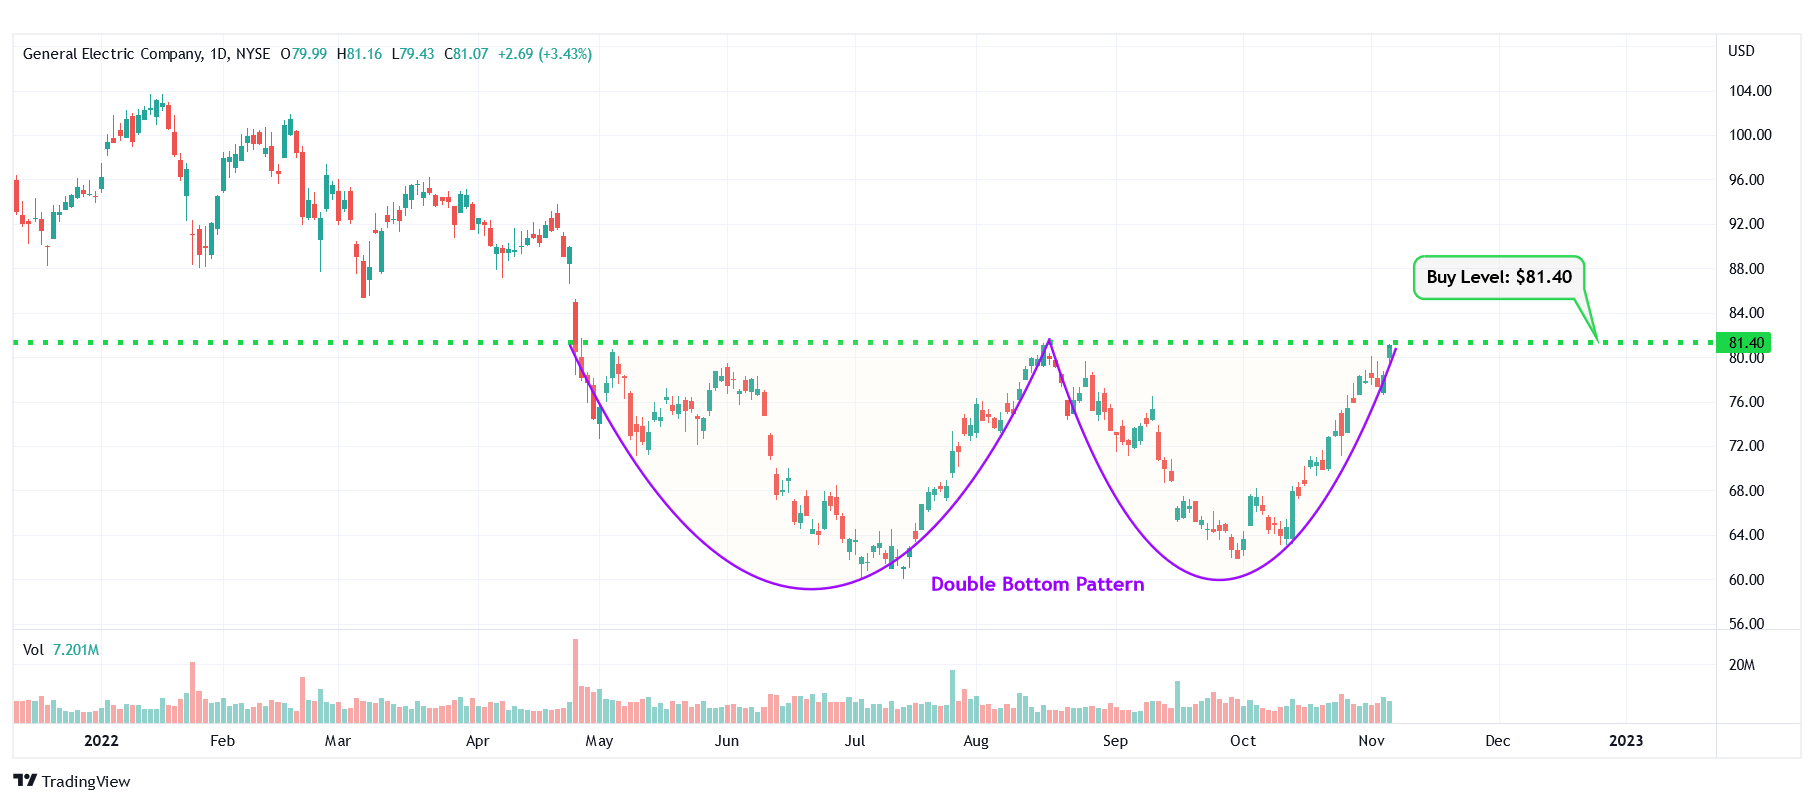
GE – Double Bottom Pattern
#6 Citizens Financial Group, Inc. (NYSE: CFG)
Sector: Financial | Banks – Regional
Reason: Falling Wedge Pattern Breakout
A falling wedge pattern is formed by joining two downward-sloping, converging trendlines having a contracting range. The pattern appears to be wide at the top and continues to contract as prices fall. A breakout from a falling wedge pattern can indicate either reversal or continuation depending on where the pattern appeared in the trend.
A stock that has broken out of a falling wedge pattern would have gained momentum and would have the potential to move higher.
Buy Level(s): The stock has currently broken out of a falling wedge pattern. However, the ideal buy level for CFG is above the nearest resistance level of $41.00. This is marked in the chart below as a green color dotted line.
Daily chart – CFG
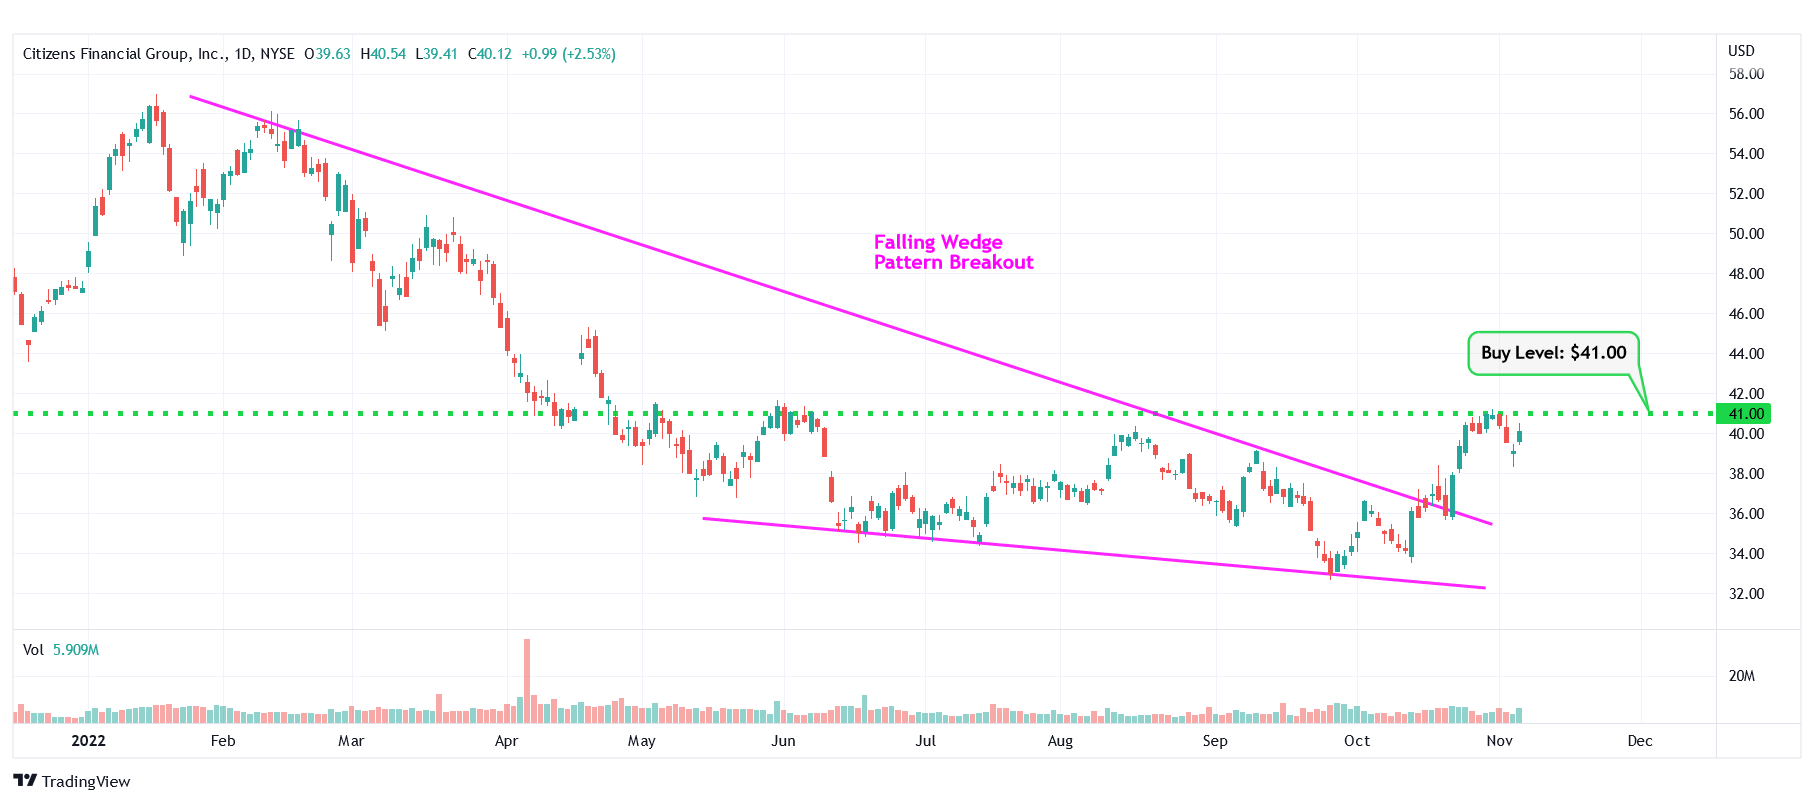
CFG – Falling Wedge Pattern Breakout
#7 Robinhood Markets, Inc. (NASDAQ: HOOD)
Sector: Technology | Software – Infrastructure
Reason: Symmetrical Triangle Pattern Breakout
A symmetrical triangle is a chart pattern formed by two converging trend lines connecting a series of sequential peaks and troughs. These two lines result in the formation of a triangle that appears to be symmetrical.
A symmetrical triangle pattern is usually formed when there is indecision in the price movements and there is uncertainty among the buyers and sellers. This chart pattern represents a period of consolidation before the price breaks out or breaks down. In case a breakout occurs from the upper trend line, it is a strong bullish indication as it signifies the start of a new bullish trend.
Buy Level(s): The stock has currently broken out of a symmetrical triangle pattern. However, the ideal buy level for HOOD is if the stock closes above the immediate resistance level of $12.40. This is marked in the chart below as a green color dotted line.
Daily chart – HOOD
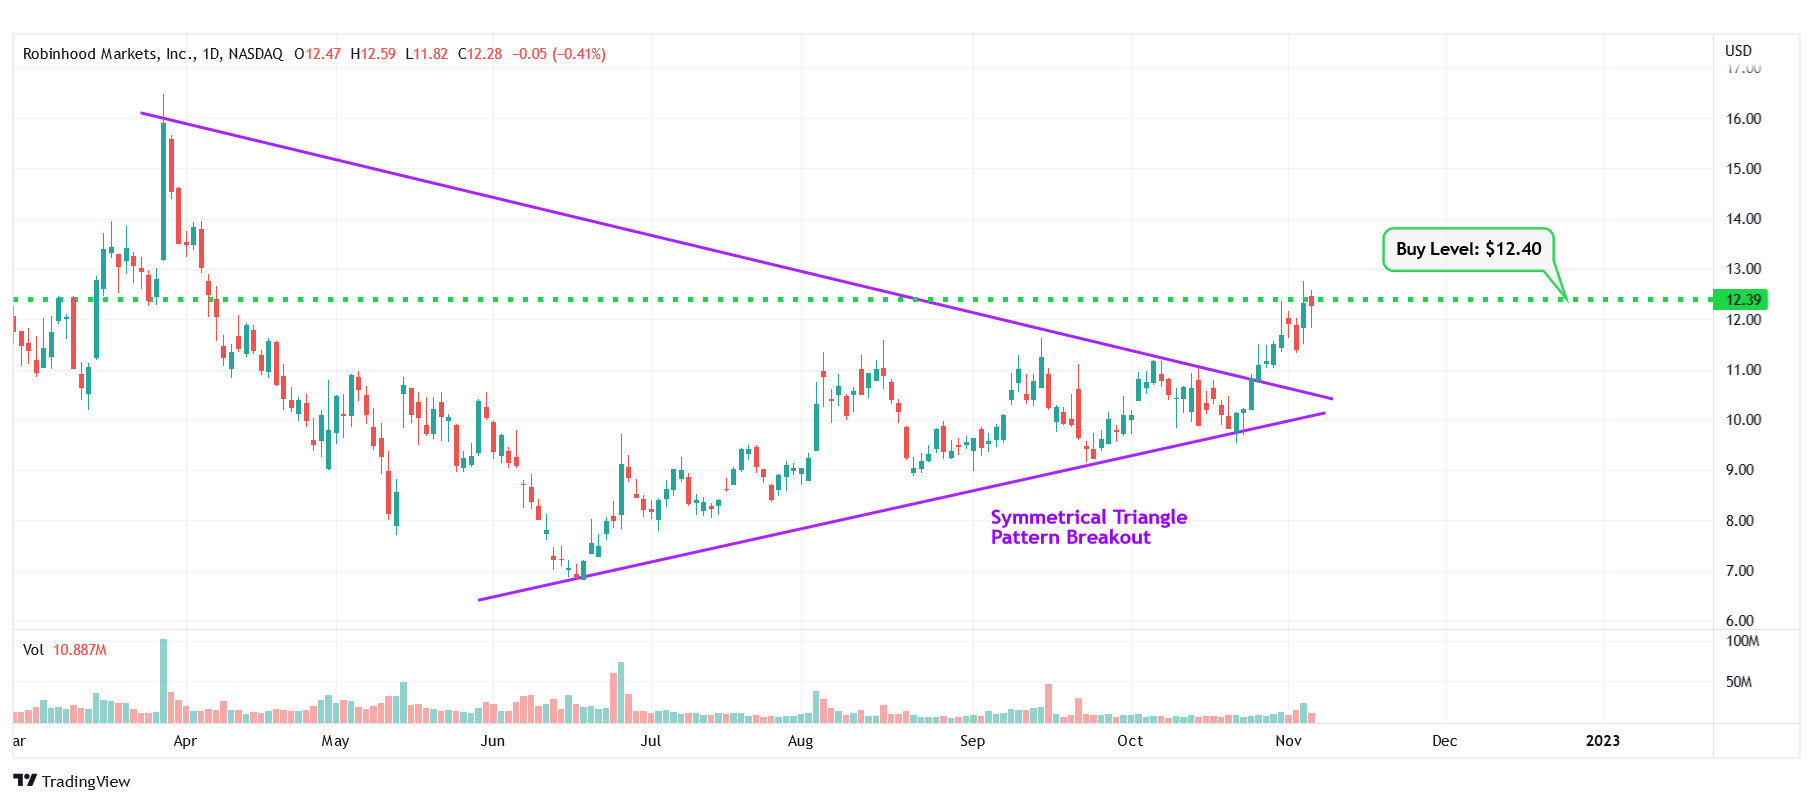
HOOD – Symmetrical Triangle Pattern Breakout
#8 NerdWallet, Inc. (NASDAQ: NRDS)
Sector: Financial | Credit Services
Reason: Breakout From a Consolidation Area
A Consolidation Area is a price action contained between two parallel lines. It is formed by a lower line that connects the lows, and an upper line that joins the highs. A stock usually trades between the two lines of the consolidation area before finally breaking out from the upper rail.
Buy Level(s): Although the stock has currently broken out of a consolidation area, the ideal buy level for NRDS is above the near-term resistance area, which translates to a price of around $13.80. This is marked in the chart below as a green color dotted line.
Daily chart – NRDS
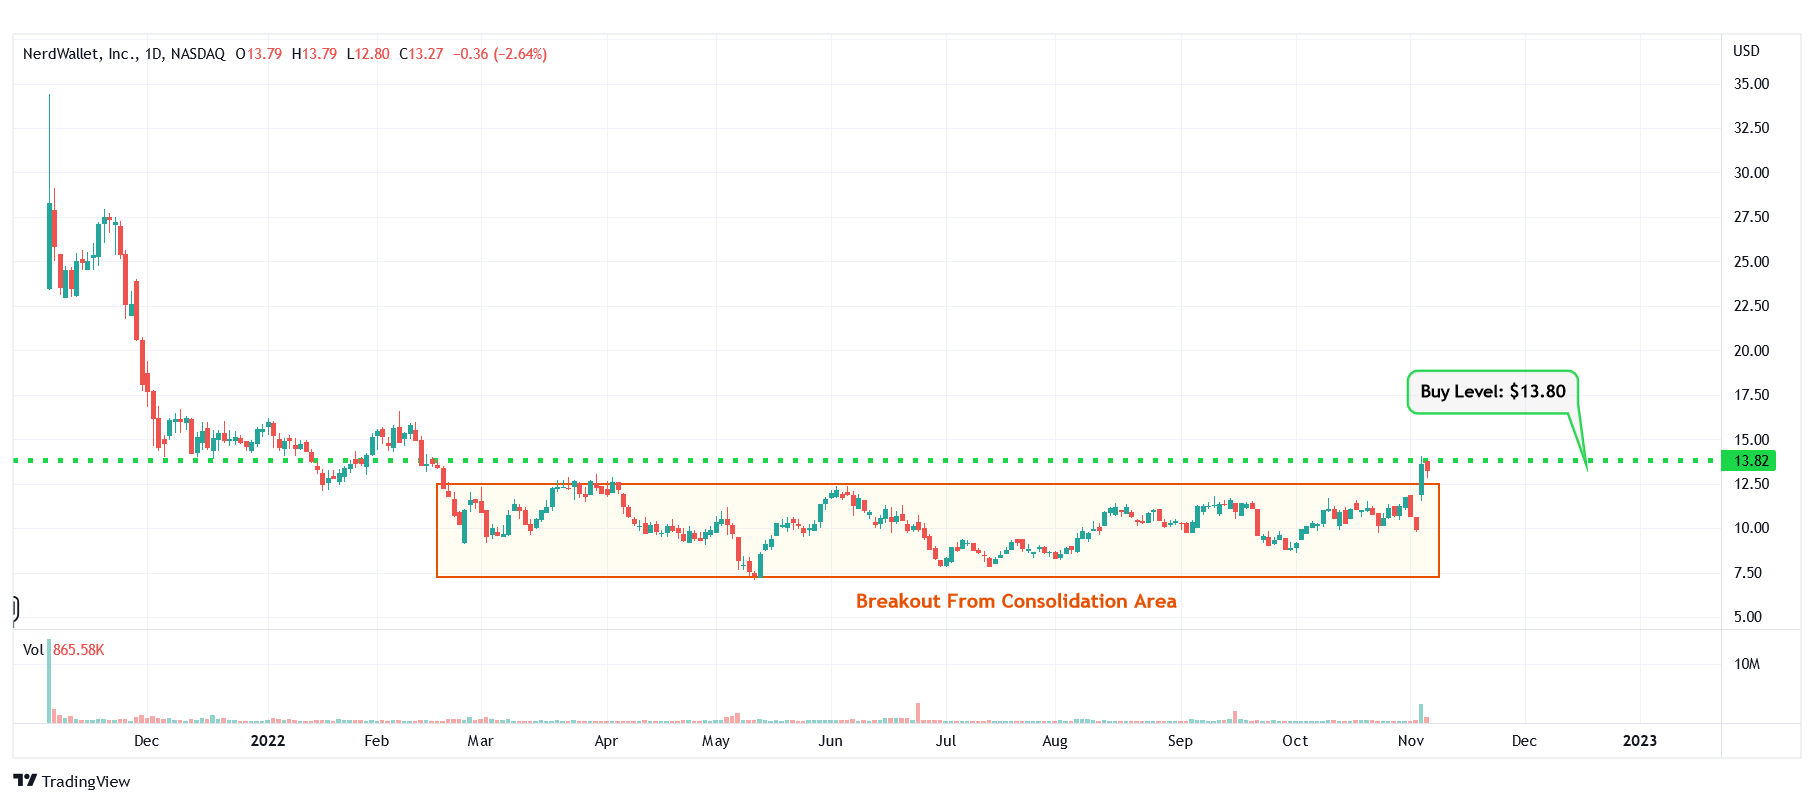
NRDS – Breakout From Consolidation Area
#9 Micron Technology, Inc. (NASDAQ: MU)
Sector: Technology | Semiconductors
Reason: Falling Wedge Pattern Breakout
A falling wedge pattern is formed by joining two downward-sloping, converging trendlines having a contracting range. The pattern appears to be wide at the top and continues to contract as prices fall. A breakout from a falling wedge pattern can indicate either reversal or continuation depending on where the pattern appeared in the trend.
A stock that has broken out of a falling wedge pattern would have gained momentum and would have the potential to move higher.
Buy Level(s): The stock has currently broken out of a falling wedge pattern. However, the ideal buy level for MU is above the nearest resistance level of $58.20. This is marked in the chart below as a green color dotted line.
Daily chart – MU
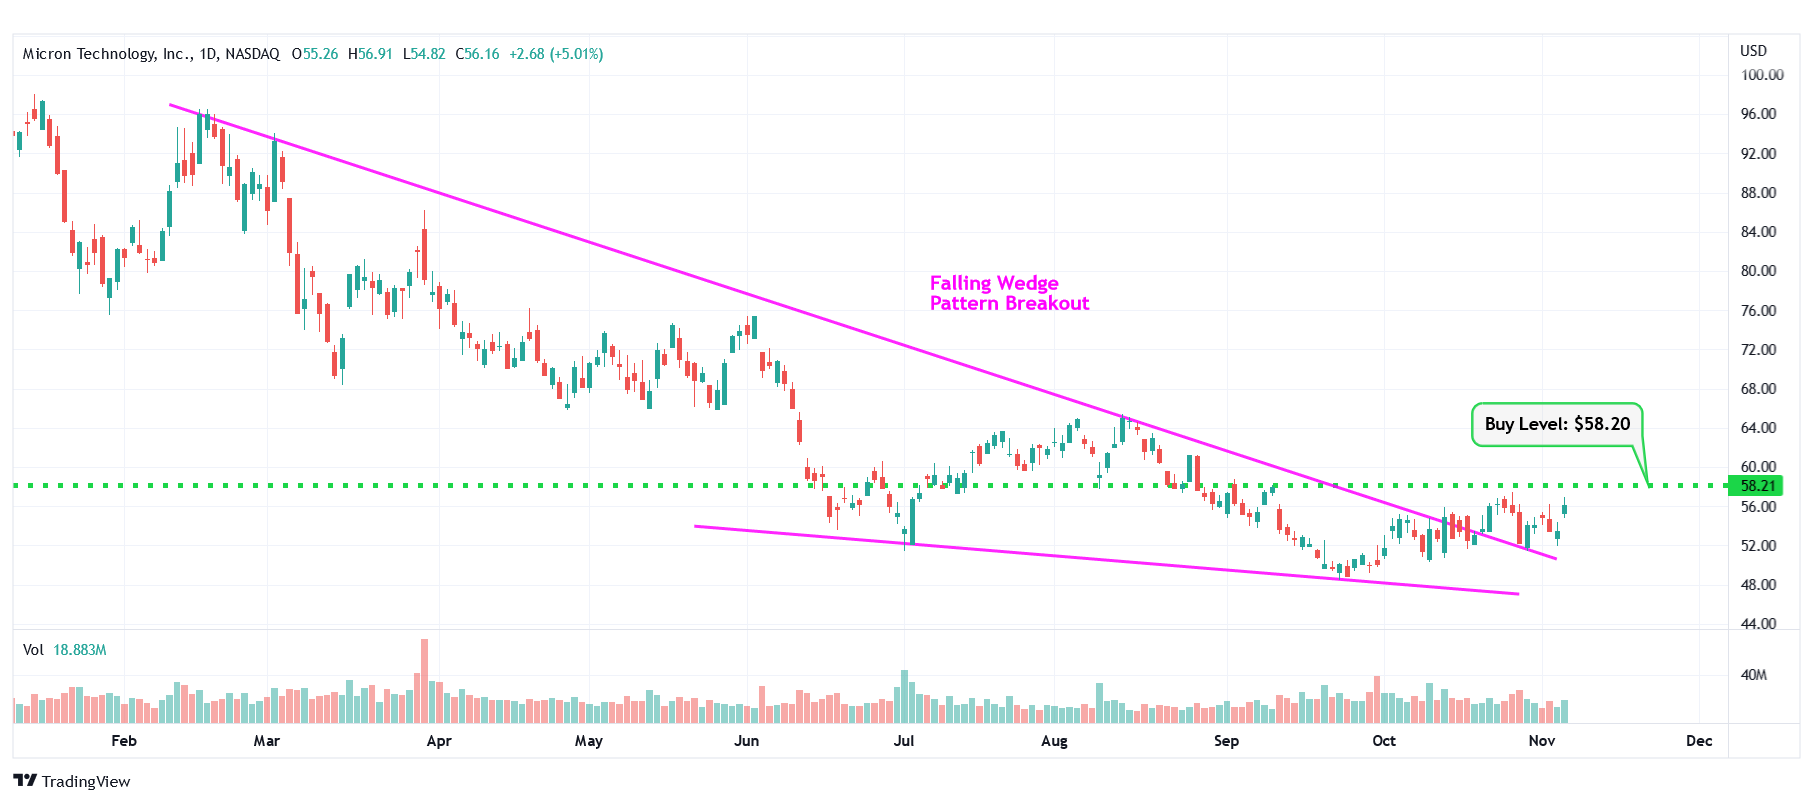
MU – Falling Wedge Pattern Breakout
#10 Valley National Bancorp (NASDAQ: VLY)
Sector: Financial | Banks – Regional
Reason: Formation of a Symmetrical Triangle Pattern
A symmetrical triangle is a chart pattern formed by two converging trend lines connecting a series of sequential peaks and troughs. These two lines result in the formation of a triangle that appears to be symmetrical.
A symmetrical triangle pattern is usually formed when there is indecision in the price movements and there is uncertainty among the buyers and sellers. This chart pattern represents a period of consolidation before the price breaks out or breaks down. In case a breakout occurs from the upper trend line, it is a strong bullish indication as it signifies the start of a new bullish trend.
Buy Level(s): The ideal buy level for VLY is if the stock has a daily close above the breakout level of the symmetrical triangle pattern, at around $12.20. This is marked in the chart below as a green color dotted line.
Daily chart – VLY
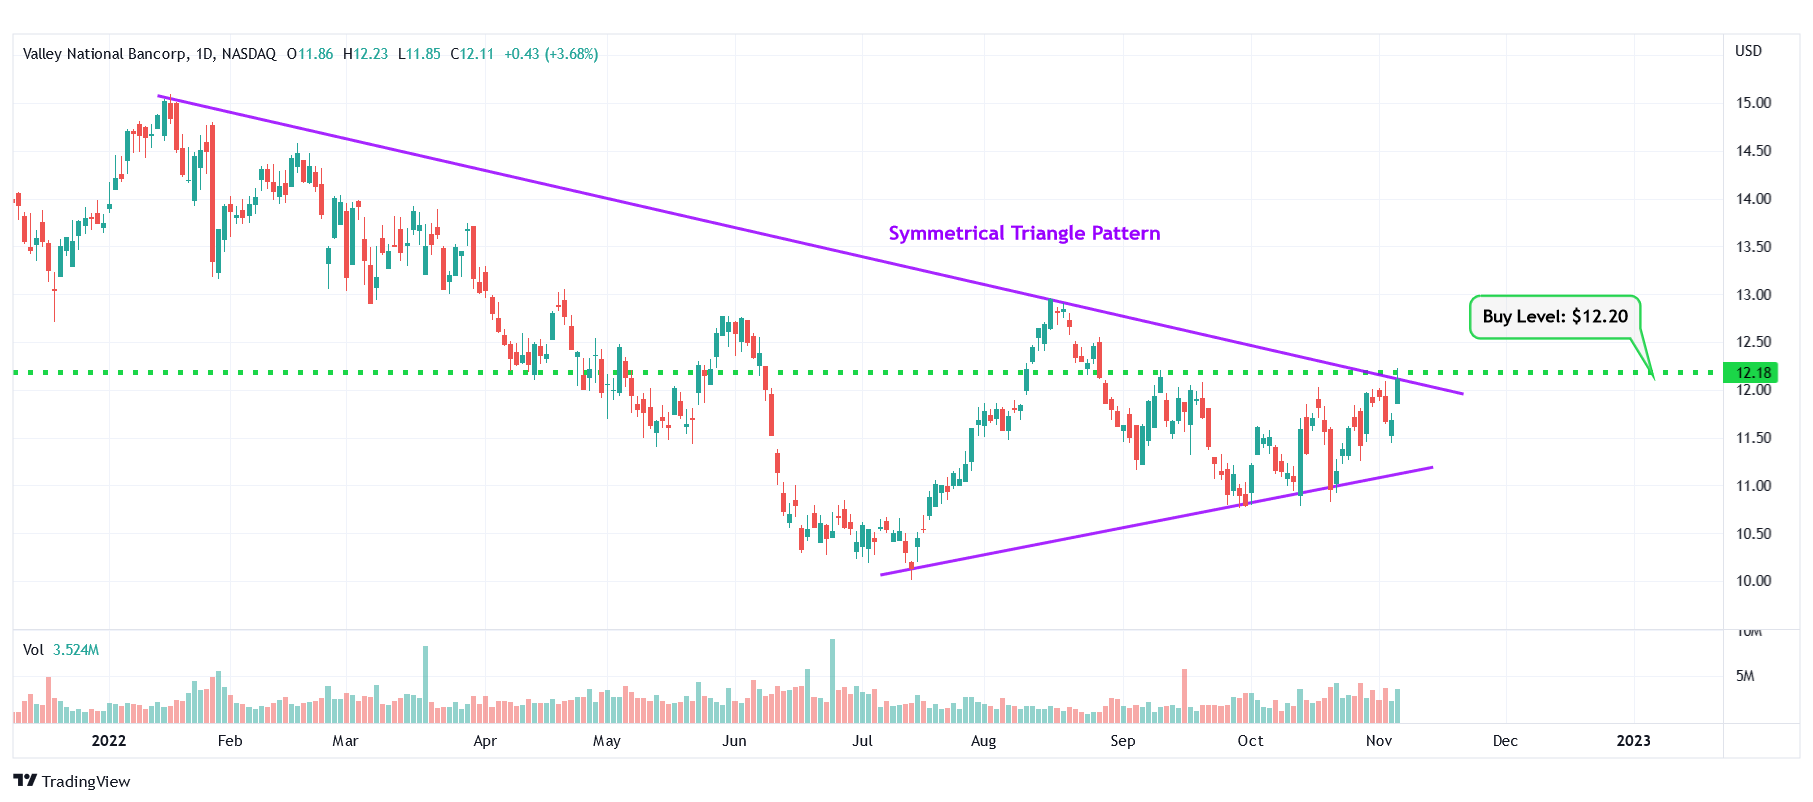
VLY – Symmetrical Triangle Pattern
Happy Trading!
Trades of The Day Research Team
The old way of investing in tech giants is over. A NEW strategy unlocks 146X more income on the SAME underlying stocks (like Meta, Apple, and Amazon) -- WITHOUT options trading. Click here to uncover the NEW MAG-7 alternative.
Source: Trades of the Day
