
Picking a winning trade on a consistent basis is not simply a stroke of luck. It’s the result of calculated screening, planning, and deliberation.
With this in mind, we have started a new weekly series on our top 10 stocks to watch this week — stocks that look poised for a possible breakout in the coming days. Traders should add these stocks to their watchlist now.
The Top 10 Stocks to Watch This Week for Possible Breakouts
| Sl # | Name of the Stock | Stock Ticker | Last Close | Buy Level(s) | Reason |
| 1 | Healthcare Trust of America, Inc. | NYSE: HTA | $28.64 | $29.60 | Ascending Triangle Pattern |
| 2 | Magnite, Inc. | NASDAQ: MGNI | $33.85 | $36.00 | Symmetrical Triangle Pattern Breakout |
| 3 | Astra Space, Inc. | NASDAQ: ASTR | $10.77 | $15.70 | Downtrend Channel |
| 4 | The Goodyear Tire & Rubber Company | NASDAQ: GT | $16.26 | $17.20 | Symmetrical Triangle Pattern Breakout |
| 5 | Constellium SE | NYSE: CSTM | $19.00 | $20.00 | Inverted Head and Shoulders Pattern |
| 6 | Aurinia Pharmaceuticals Inc. | NASDAQ: AUPH | $14.42 | $15.00 | Symmetrical Triangle Pattern |
| 7 | Dynavax Technologies Corporation | NASDAQ: DVAX | $10.74 | $11.20 | Ascending Triangle Pattern |
| 8 | Bitfarms Ltd. | NASDAQ: BITF | $5.95 | $6.80 | Consolidation Area |
| 9 | Yelp Inc. | NYSE: YELP | $39.15 | $44.00 | Ascending Triangle Pattern |
| 10 | Livent Corporation | NYSE: LTHM | $22.12 | $24.00 | Symmetrical Triangle Pattern Breakout |
Important: Typically, these trades offer a risk: reward ratio of 1:2 or 1:3 in the next 6 months, which implies 2x to 3x rewards when compared to risks. So, be sure to set your stop-loss levels and target prices accordingly to manage your risk. In addition, these trade ideas are triggered using daily closing prices, not intra-day pricing. So, if you participate in these trades, make sure that you only buy the stock once its daily close is above the recommended price level.
That said, here are the top 10 stocks to watch for a breakout, in no particular order.
#1 Healthcare Trust of America, Inc. (NYSE: HTA)
Sector: Real Estate | REIT – Healthcare Facilities
Reason: Formation of an Ascending Triangle Pattern
An ascending triangle pattern is a bullish pattern formed by drawing a horizontal line along the swing highs, and a rising trendline along the swing lows. These two lines result in the formation of a triangle. A breakout from this pattern is typically a strong bullish indication.
Buy Level(s): The ideal buy level for HTA is if the stock has a daily close above the breakout level of the ascending triangle pattern, at around $29.60. This is marked in the chart below as a green color dotted line.
Daily chart – HTA
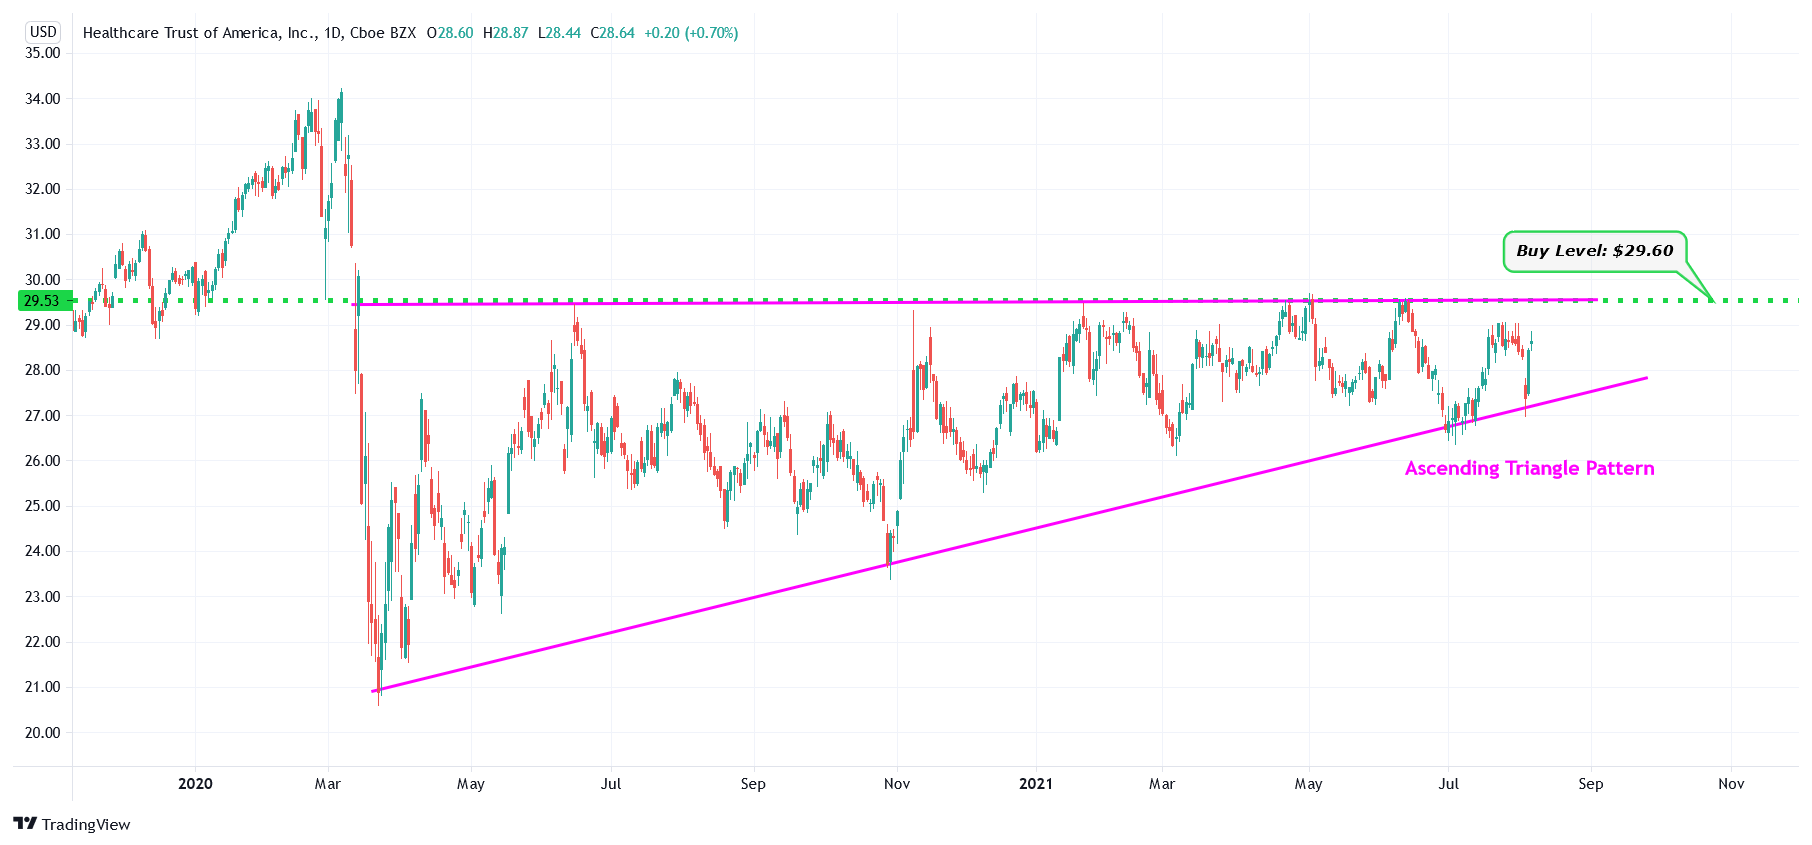
HTA – Ascending Triangle Pattern
#2 Magnite, Inc. (NASDAQ: MGNI)
Sector: Communication Services | Advertising Agencies
Reason: Breakout from a Symmetrical Triangle Pattern
A symmetrical triangle is a chart pattern formed by two converging trend lines connecting a series of sequential peaks and troughs. These two lines result in the formation of a triangle that appears to be symmetrical.
A symmetrical triangle pattern is usually formed when there is an indecision in the price movements and there is uncertainty among the buyers and sellers. This chart pattern represents a period of consolidation before the price breaks out or breaks down. In case a breakout occurs from the upper trend line, it is a strong bullish indication as it signifies the start of a new bullish trend.
Buy Level(s): The daily chart shows that the stock has currently broken out of a symmetrical triangle pattern. However, there is a near-term resistance level for the stock. Hence, the ideal buy level for MGNI is if the stock has a daily close above $36.00. This is marked in the chart below as a green color dotted line.
Daily chart – MGNI
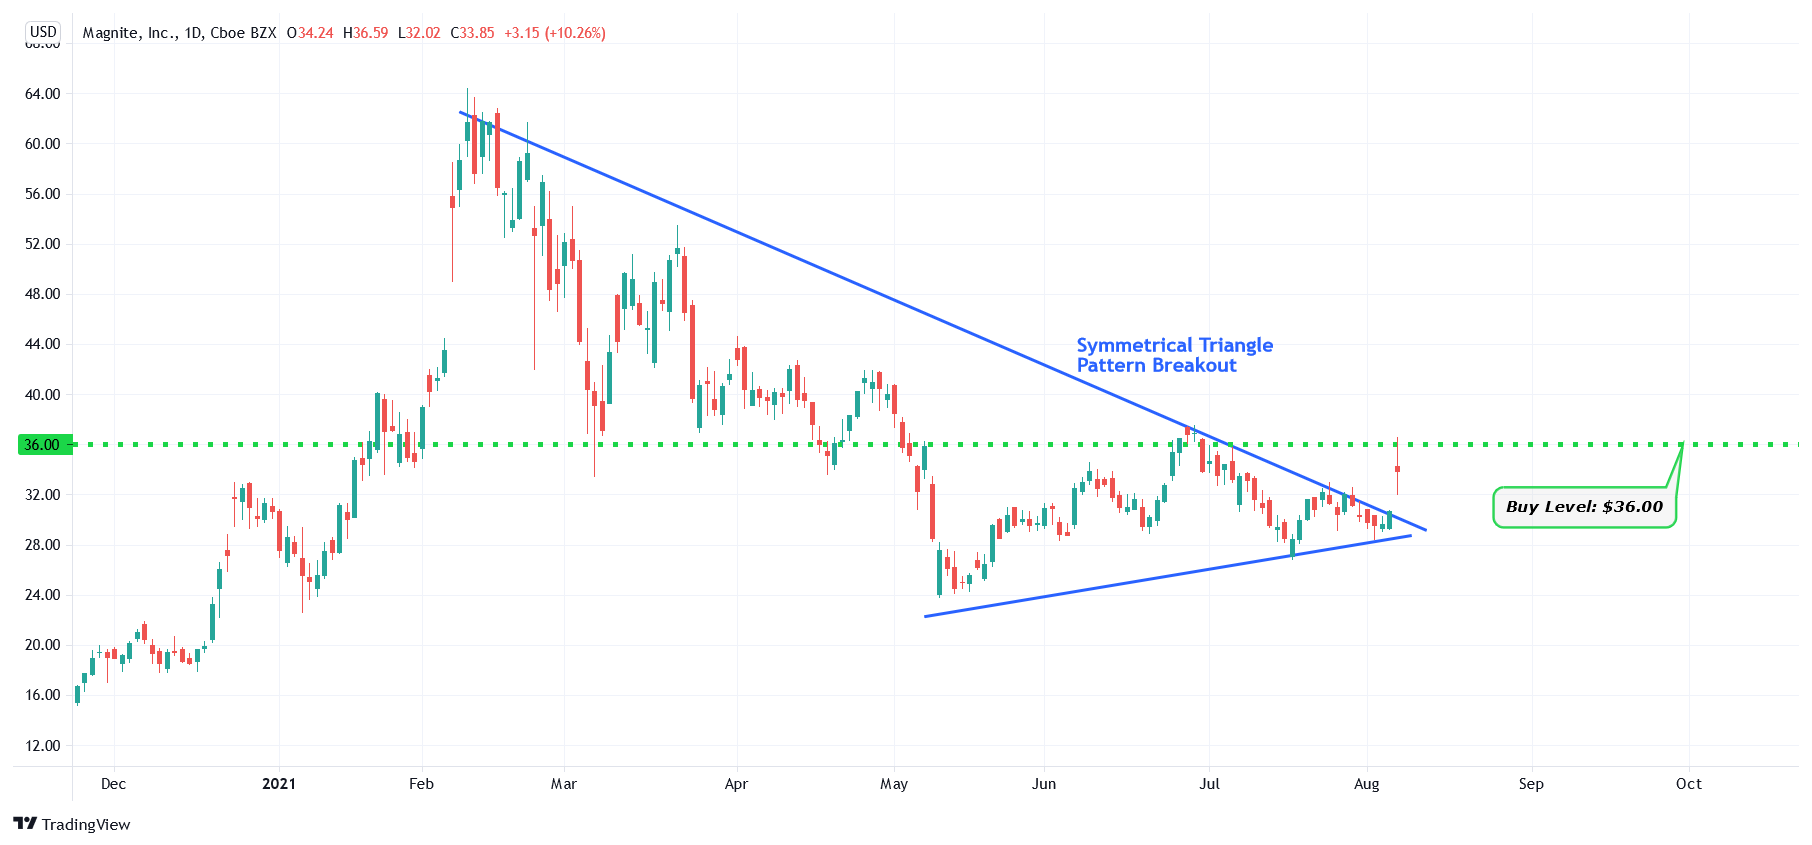
MGNI – Symmetrical Triangle Pattern Breakout
#3 Astra Space, Inc. (NASDAQ: ASTR)
Sector: Industrials | Aerospace & Defense
Reason: Formation of a Downtrend Channel
A downtrend or descending channel is the price action contained between downward sloping parallel lines. It is formed by two lines that are drawn by connecting the lower highs and lower lows of a stock’s price. Even though this is typically a bearish pattern, a breakout from the upper rail of this pattern is considered a good bullish indication.
Buy Level(s): The ideal buy level for ASTR is if the stock has a daily close above the breakout level of the downtrend channel and closes above the near-term resistance level of $15.70. This is marked in the chart below as a green color dotted line.
Daily chart – ASTR
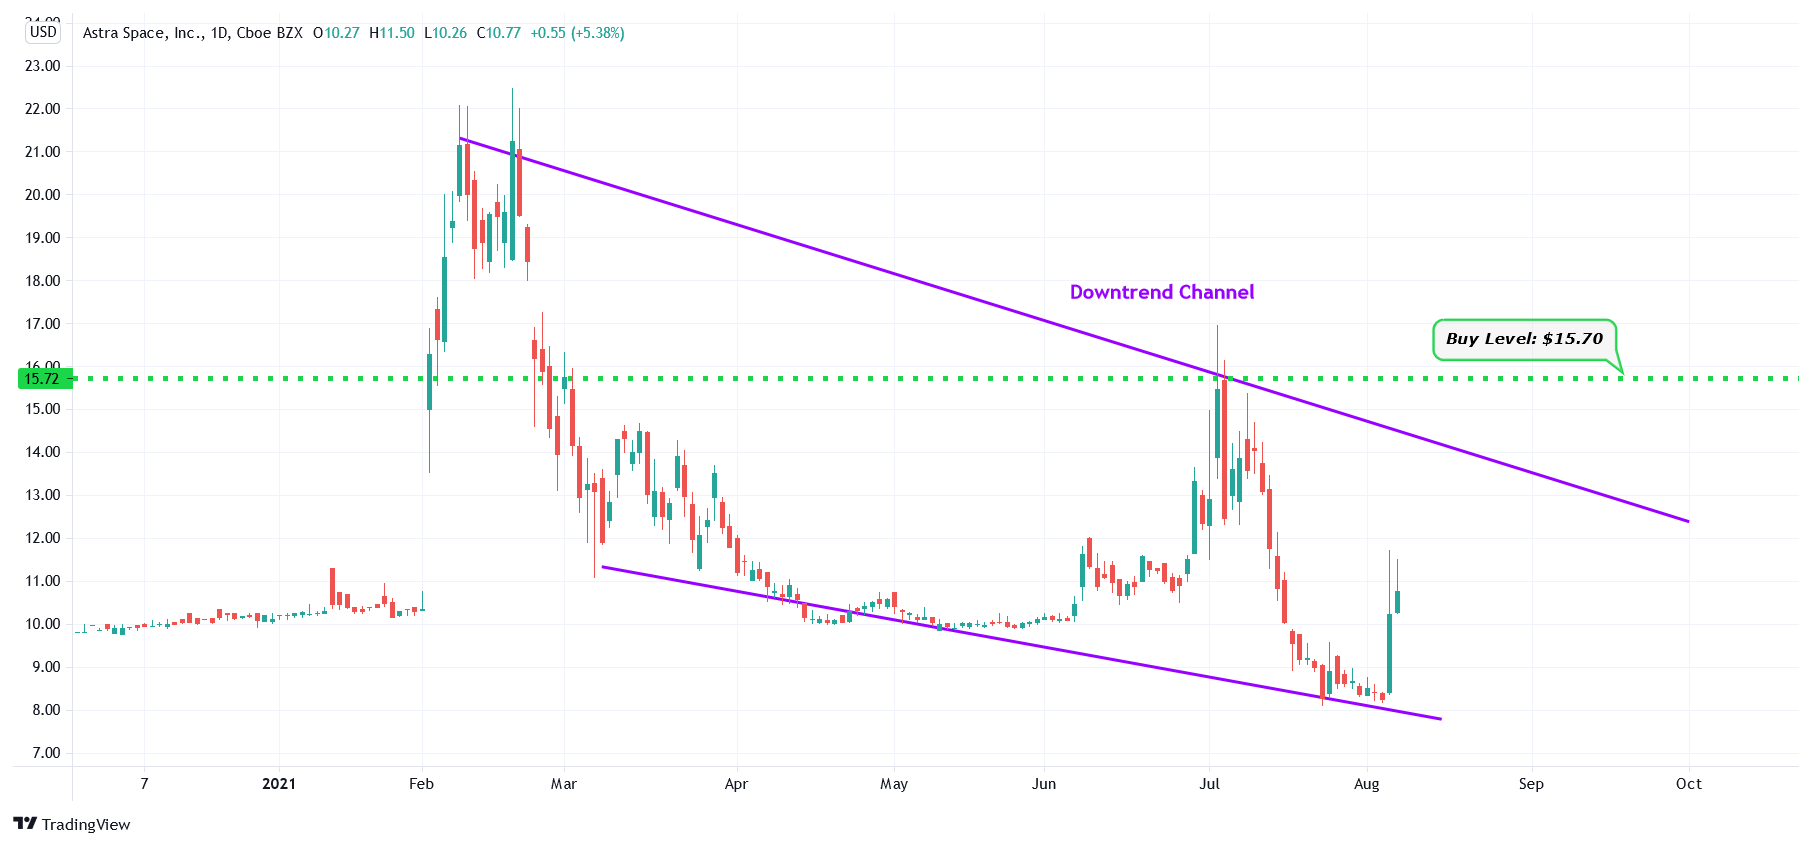
ASTR – Downtrend Channel Pattern
#4 The Goodyear Tire & Rubber Company (NASDAQ: GT)
Sector: Consumer Cyclical | Auto Parts
Reason: Breakout from a Symmetrical Triangle Pattern
A symmetrical triangle is a chart pattern formed by two converging trend lines connecting a series of sequential peaks and troughs. These two lines result in the formation of a triangle that appears to be symmetrical.
A symmetrical triangle pattern is usually formed when there is an indecision in the price movements and there is uncertainty among the buyers and sellers. This chart pattern represents a period of consolidation before the price breaks out or breaks down. In case a breakout occurs from the upper trend line, it is a strong bullish indication as it signifies the start of a new bullish trend.
Buy Level(s): The daily chart shows that the stock has currently broken out of a symmetrical triangle pattern. However, there is a near-term resistance level for the stock. Hence, the ideal buy level for GT is if the stock has a daily close above $17.20. This is marked in the chart below as a green color dotted line.
Daily chart – GT
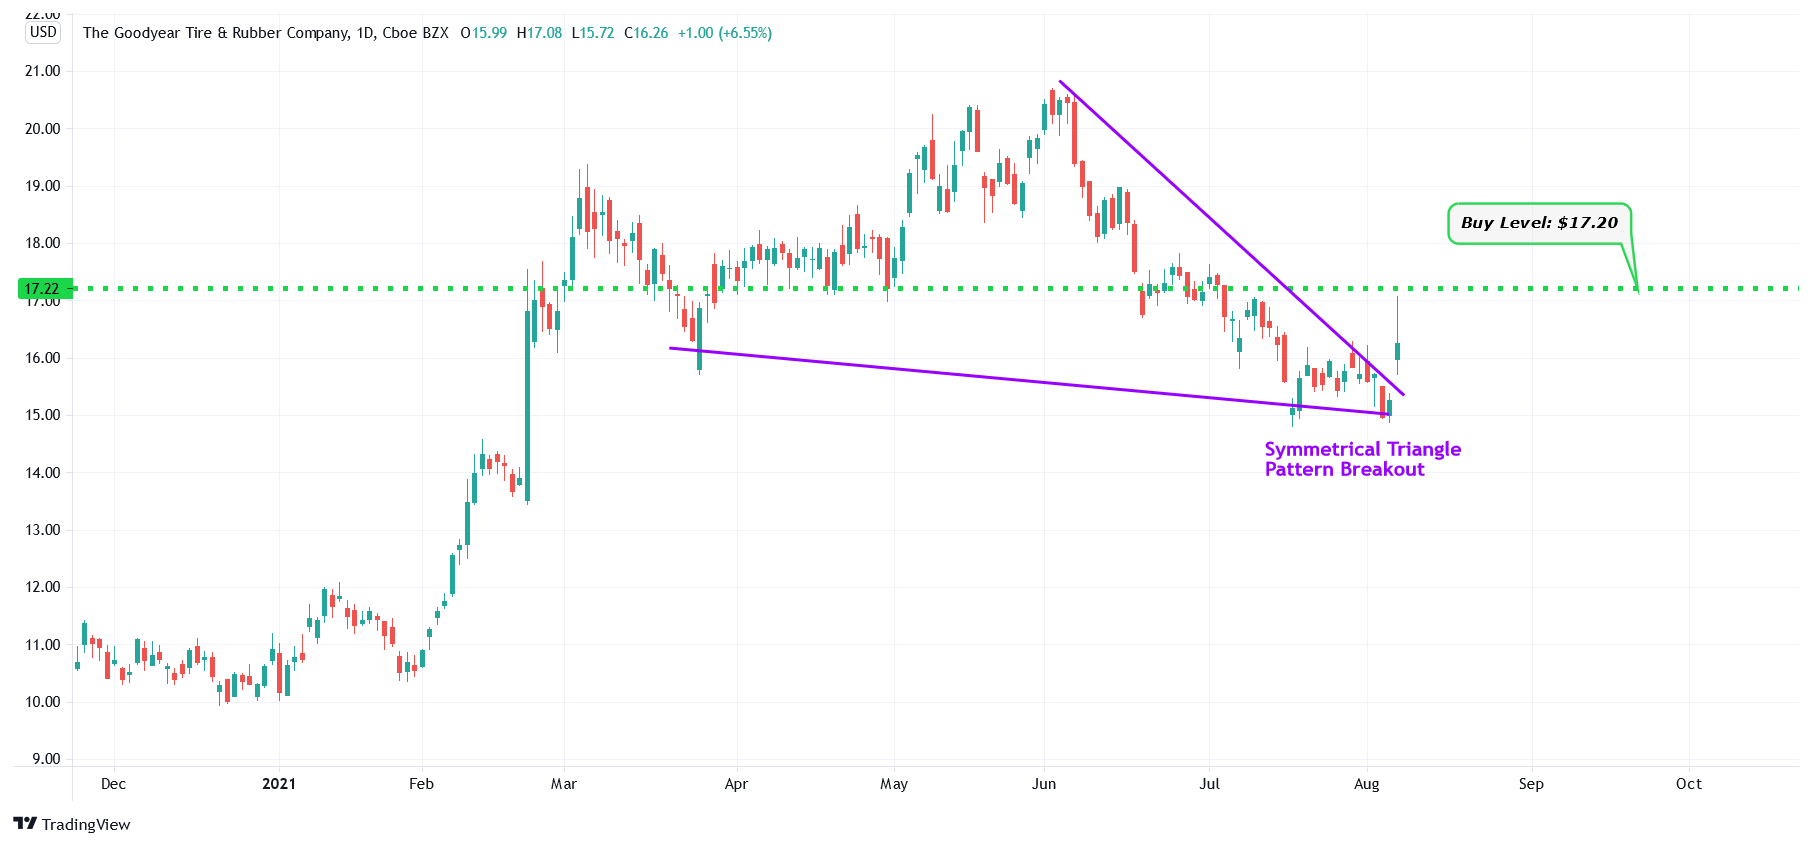
GT- Symmetrical Triangle Pattern Breakout
#5 Constellium SE (NYSE: CSTM)
Sector: Basic Materials | Aluminum
Reason: Formation of an Inverted Head and Shoulders (IH&S) Pattern
An inverse head and shoulders pattern signifies the reversal of a downward trend. The pattern is formed when the price falls to a trough and then rises; then falls below the former trough and then rises again; and finally, the price falls again but not as far as the second trough and then rises again. The neckline of this pattern would be the resistance found near the top of the previous troughs. Once a breakout from this pattern occurs, it signifies a bullish trend.
Buy Level(s): The ideal buy level for CSTM is if the stock has a daily close above the breakout level of the IH&S pattern, at around $20.00. This is marked in the chart below as a green color dotted line.
Daily chart – CSTM
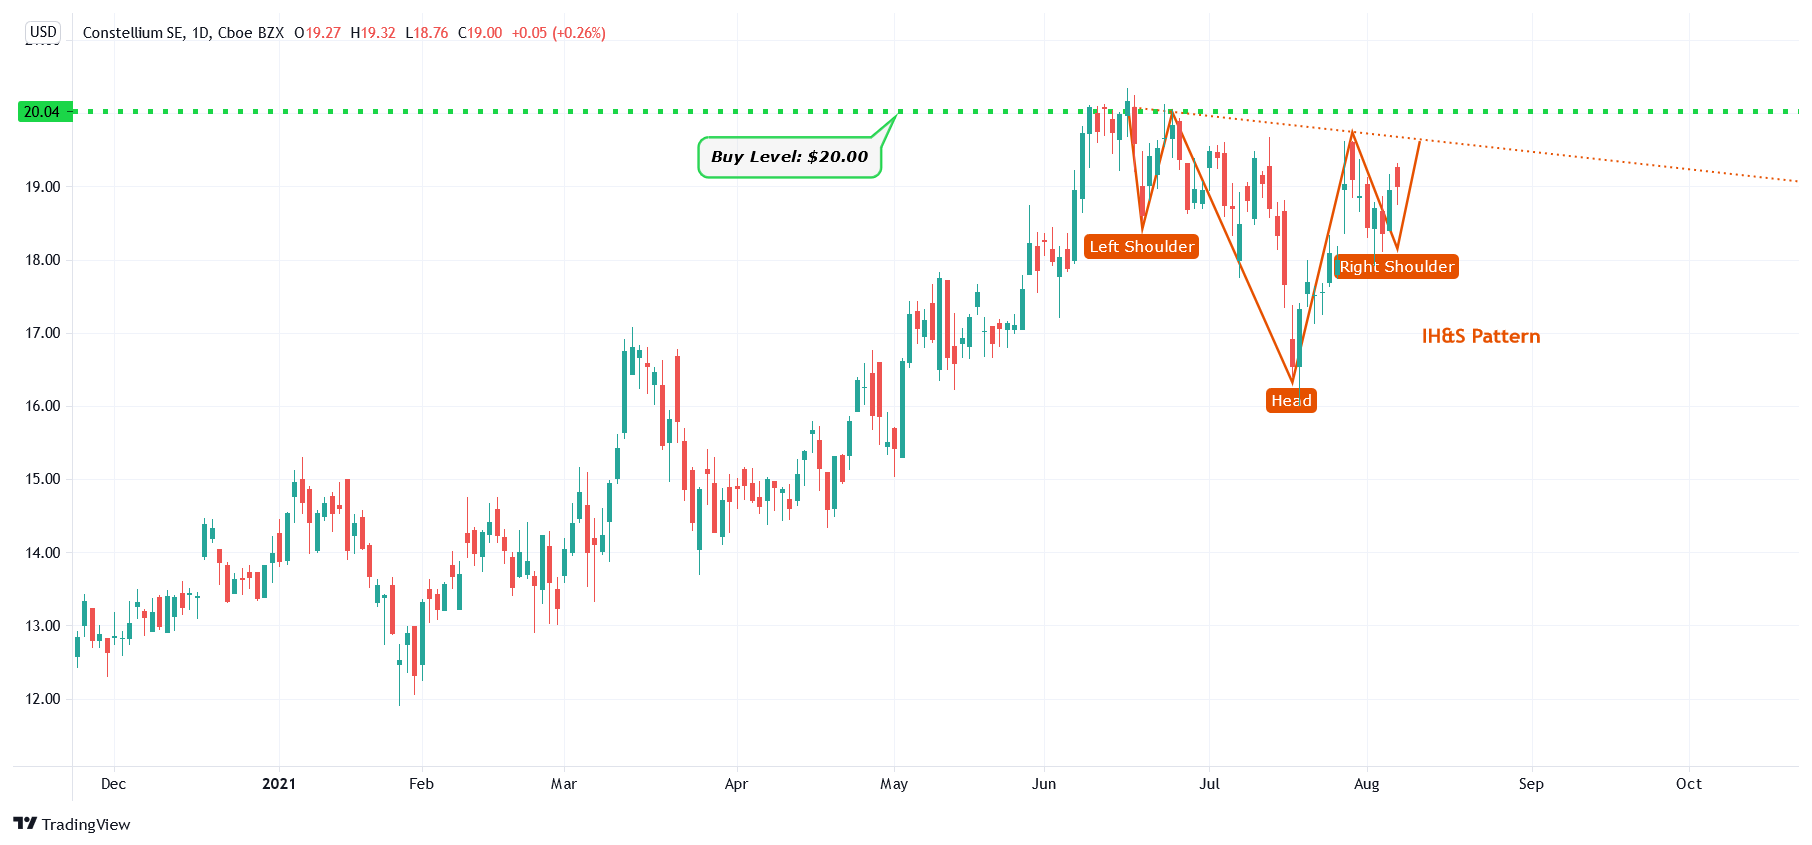
CSTM – Inverted Head And Shoulders Pattern
#6 Aurinia Pharmaceuticals Inc. (NASDAQ: AUPH)
Sector: Healthcare | Biotechnology
Reason: Formation of a Symmetrical Triangle Pattern
A symmetrical triangle is a chart pattern formed by two converging trend lines connecting a series of sequential peaks and troughs. These two lines result in the formation of a triangle that appears to be symmetrical.
A symmetrical triangle pattern is usually formed when there is an indecision in the price movements and there is uncertainty among the buyers and sellers. This chart pattern represents a period of consolidation before the price breaks out or breaks down. In case a breakout occurs from the upper trend line, it is a strong bullish indication as it signifies the start of a new bullish trend.
Buy Level(s): The ideal buy level for AUPH is if the stock has a daily close above the breakout level of the symmetrical triangle pattern, at around $15.00. This is marked in the chart below as a green color dotted line.
Daily chart – AUPH
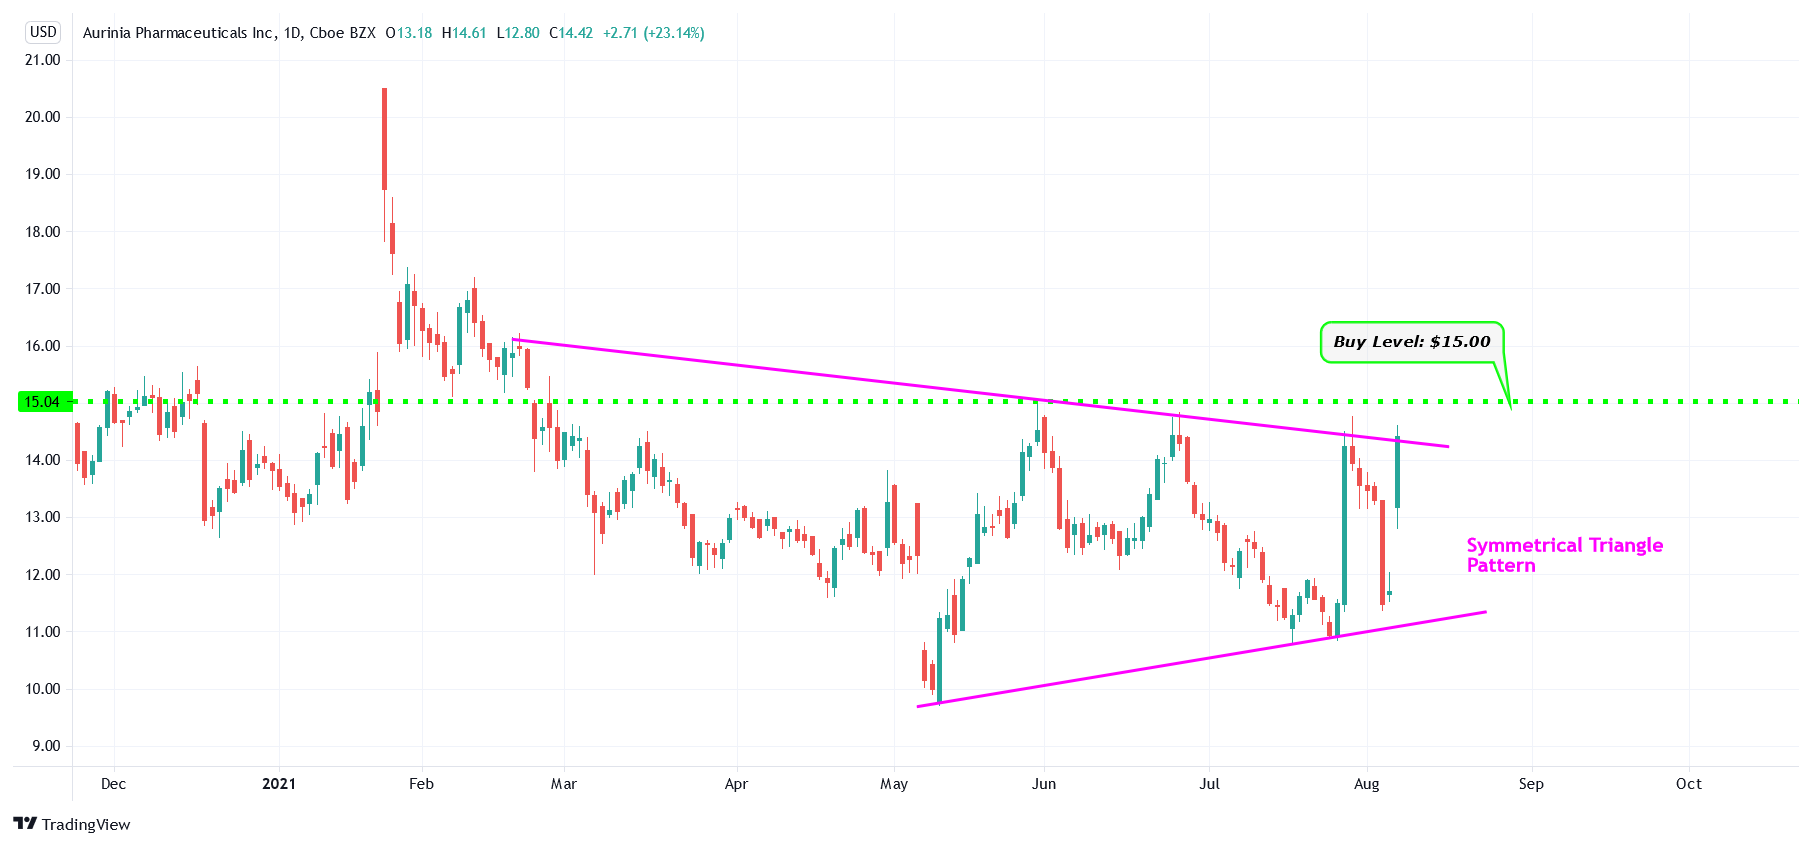
AUPH – Symmetrical Triangle Pattern
#7 Dynavax Technologies Corporation (NASDAQ: DVAX)
Sector: Healthcare | Biotechnology
Reason: Formation of an Ascending Triangle Pattern
An ascending triangle pattern is a bullish pattern formed by drawing a horizontal line along the swing highs, and a rising trendline along the swing lows. These two lines result in the formation of a triangle. A breakout from this pattern is typically a strong bullish indication.
Buy Level(s): The ideal buy level for DVAX is if the stock has a daily close above the breakout level of the ascending triangle pattern, at around $11.20. This is marked in the chart below as a green color dotted line.
Daily chart – DVAX
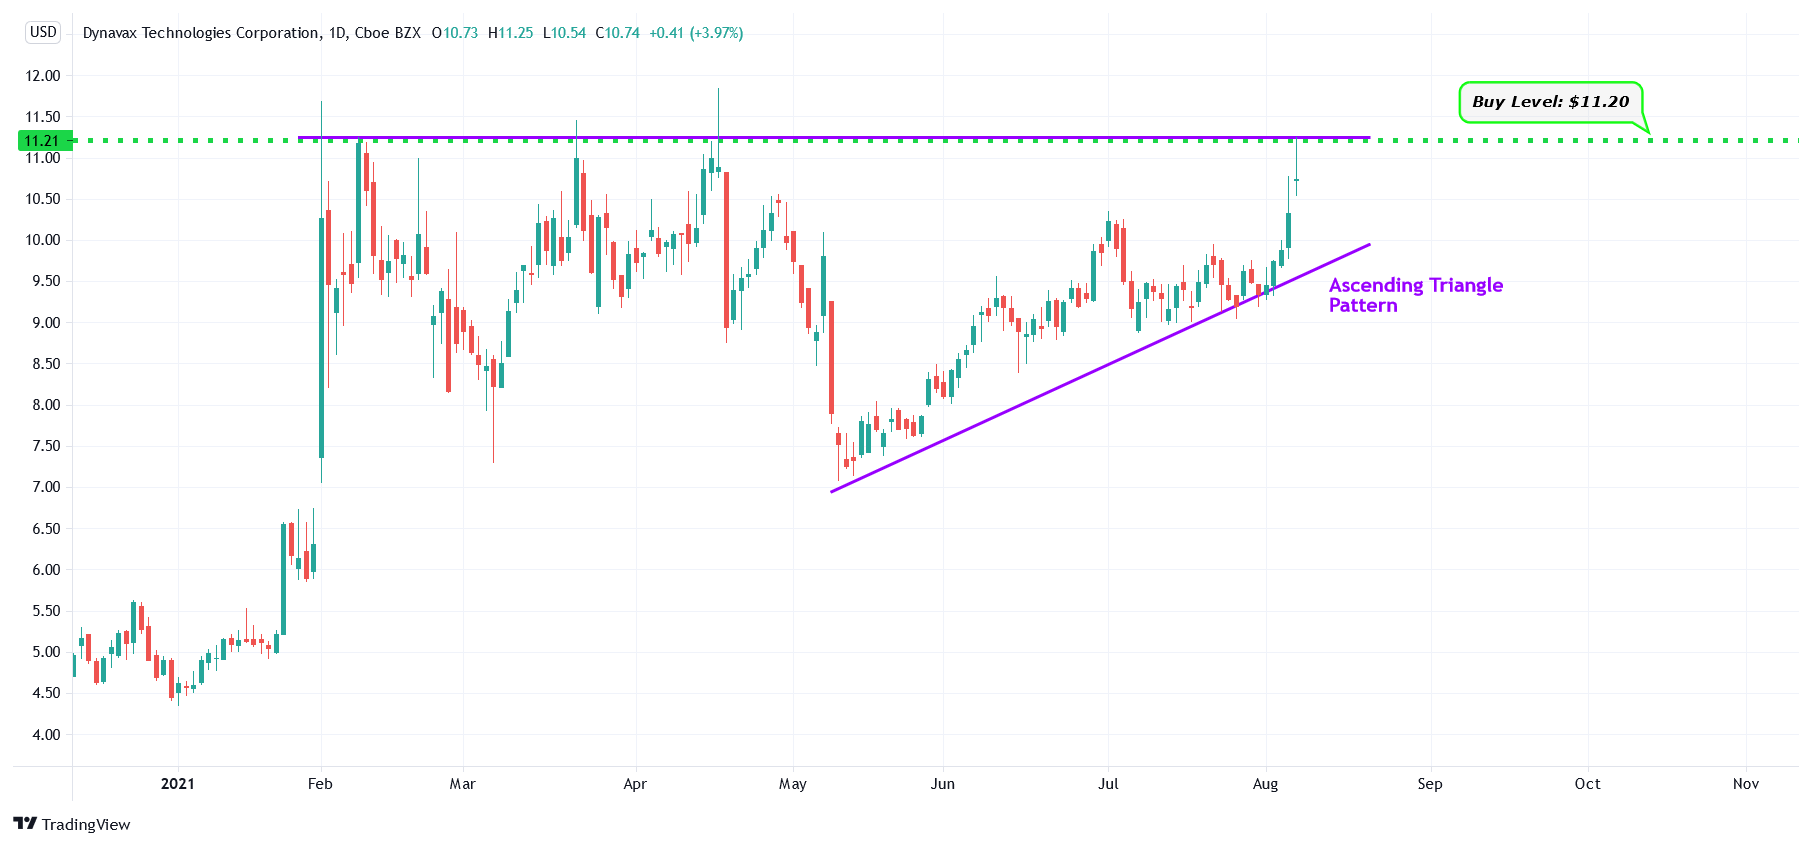
DVAX – Ascending Triangle Pattern
#8 Bitfarms Ltd. (NASDAQ: BITF)
Sector: Financial | Capital Markets
Reason: Formation of a Consolidation Area in the Daily Chart
A Consolidation Area is a price action contained between two parallel lines. It is formed by a lower line that connects the lows, and an upper line that joins the highs. A stock usually trades between the two lines of the consolidation area before finally breaking out from the upper rail.
Buy Level(s): The ideal buy level for BITF is if the stock has a daily close above the breakout level of the consolidation area, at around $6.80. This is marked in the chart below as a green color dotted line.
Daily chart – BITF
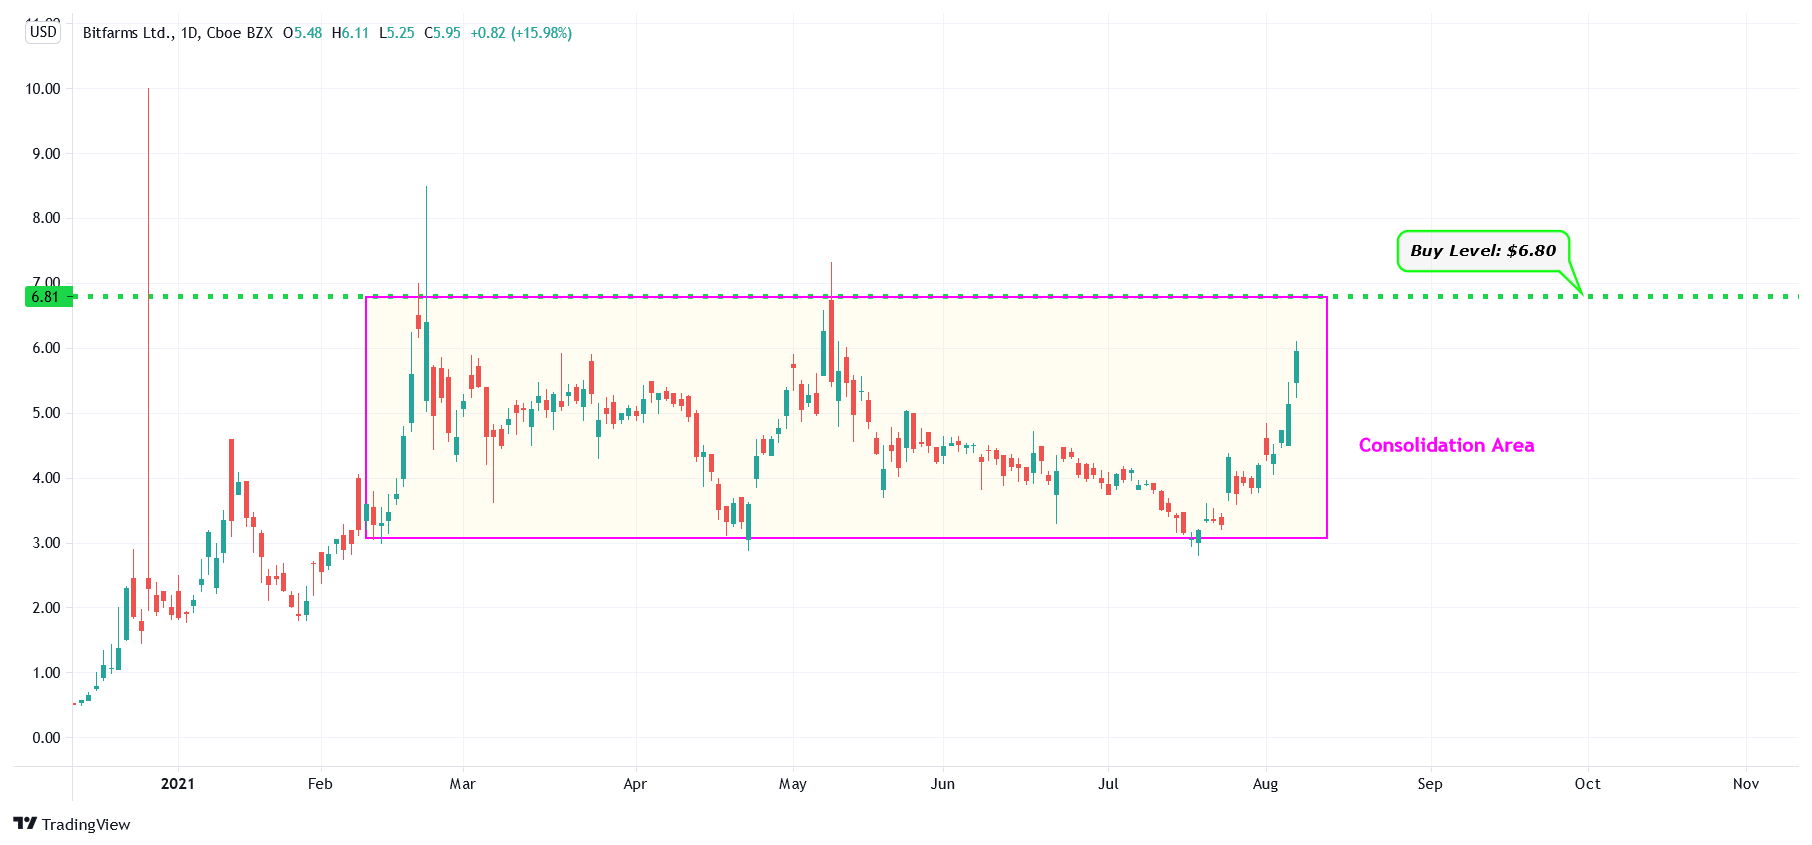
BITF – Consolidation Area
#9 Yelp Inc. (NYSE: YELP)
Sector: Communication Services | Internet Content & Information
Reason: Formation of an Ascending Triangle Pattern
An ascending triangle pattern is a bullish pattern formed by drawing a horizontal line along the swing highs, and a rising trendline along the swing lows. These two lines result in the formation of a triangle. A breakout from this pattern is typically a strong bullish indication.
Buy Level(s): The ideal buy level for YELP is if the stock has a daily close above the breakout level of the ascending triangle pattern, at around $44.00. This is marked in the chart below as a green color dotted line.
Daily chart – YELP
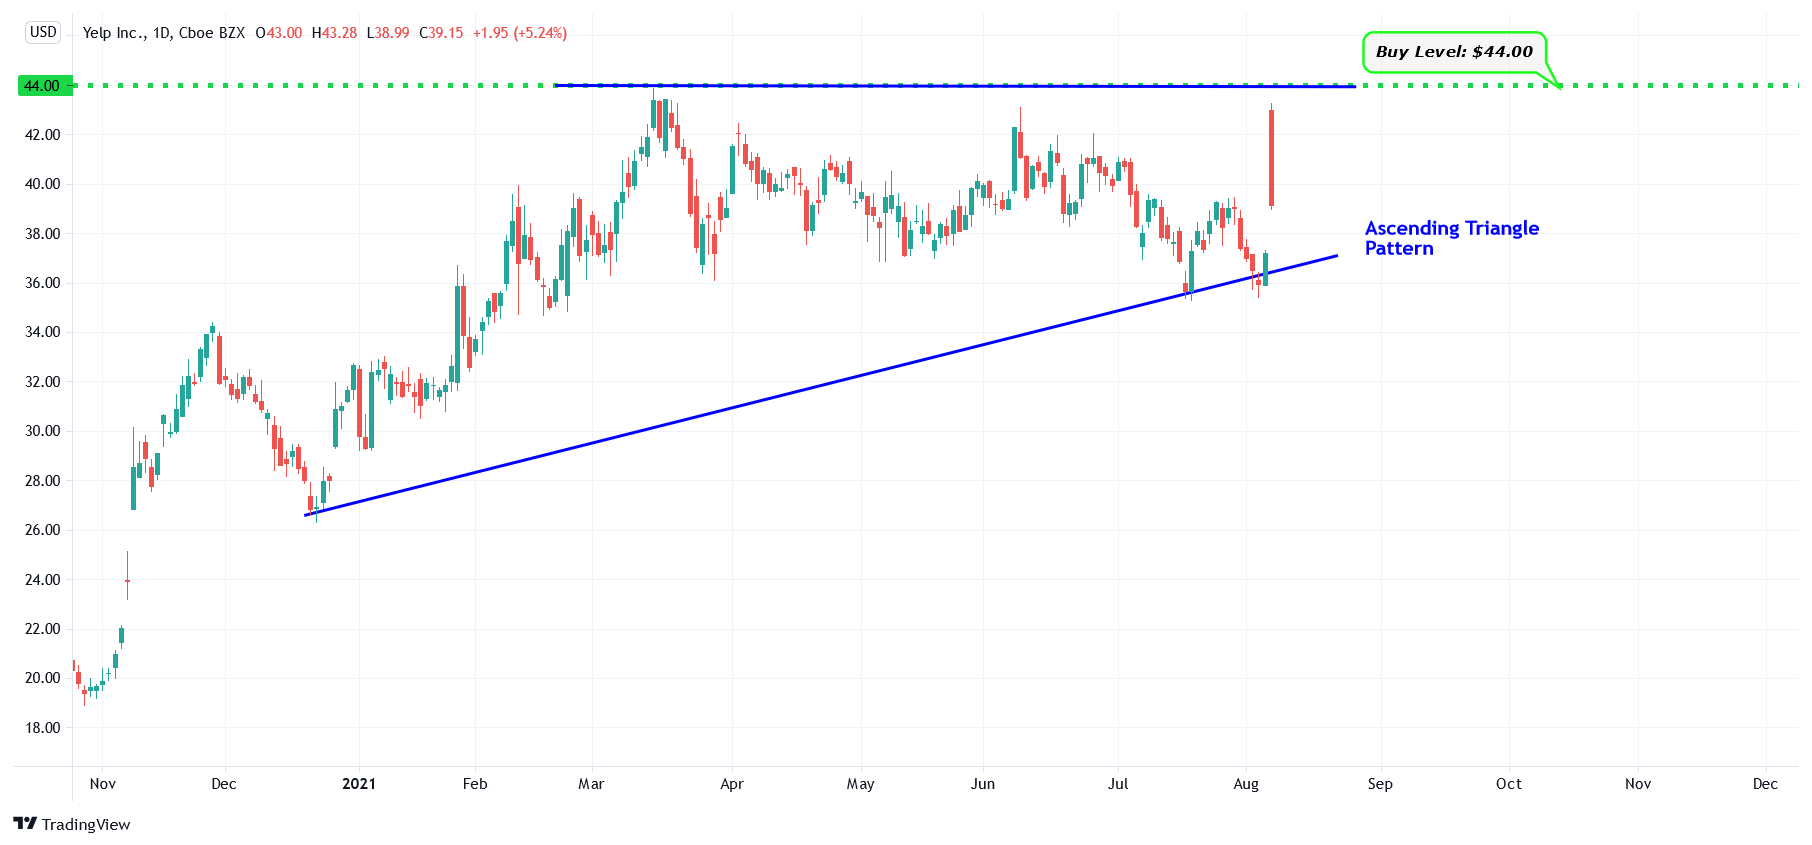
YELP – Ascending Triangle Pattern
#10 Livent Corporation (NYSE: LTHM)
Sector: Basic Materials | Specialty Chemicals
Reason: Breakout from a Symmetrical Triangle Pattern
A symmetrical triangle is a chart pattern formed by two converging trend lines connecting a series of sequential peaks and troughs. These two lines result in the formation of a triangle that appears to be symmetrical.
A symmetrical triangle pattern is usually formed when there is an indecision in the price movements and there is uncertainty among the buyers and sellers. This chart pattern represents a period of consolidation before the price breaks out or breaks down. In case a breakout occurs from the upper trend line, it is a strong bullish indication as it signifies the start of a new bullish trend.
Buy Level(s): The daily chart shows that the stock has currently broken out of a symmetrical triangle pattern. However, there is a near-term resistance level for the stock. Hence, the ideal buy level for LTHM is if the stock has a daily close above $24.00. This is marked in the chart below as a green color dotted line.
Daily chart – LTHM
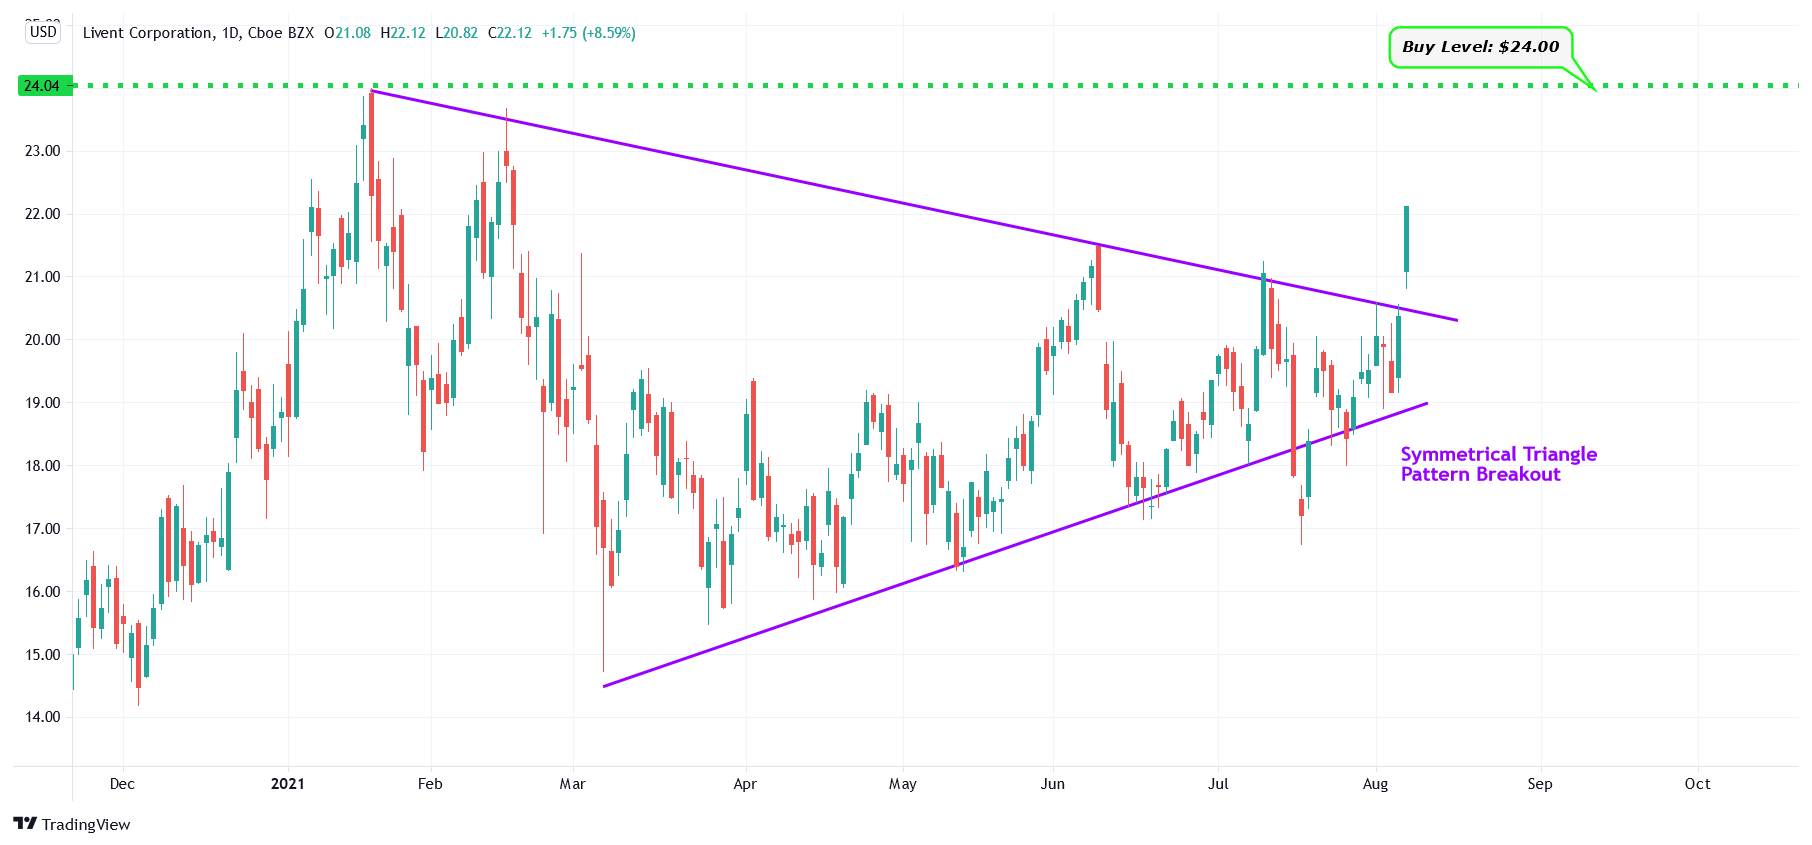
LTHM – Symmetrical Triangle Pattern Breakout
Happy Trading!
Trades of The Day Research Team
Motley Fool Stock Advisor's average stock pick is up over 350%*, beating the market by an incredible 4-1 margin. Here’s what you get if you join up with us today: Two new stock recommendations each month. A short list of Best Buys Now. Stocks we feel present the most timely buying opportunity, so you know what to focus on today. There's so much more, including a membership-fee-back guarantee. New members can join today for only $99/year.
Source: Trades of the Day
