
The company that develops, manufactures, and sells optoelectronic products that transmit, receive, and switch high speed digital optical signals for communications networks worldwide, NeoPhotonics Corp (NYSE: NPTN) seems to be gearing up for a surge as per its latest charts.
Bullish Indications
#1 Rounding Bottom Pattern: As seen from the daily chart, the stock had recently formed a rounding bottom pattern. This pattern is marked in pink color. A Rounding Bottom (saucer bottom) is a long-term reversal pattern. It represents a long consolidation period that turns from a bearish bias to a bullish bias. A breakout from this pattern indicates that the stock may move higher. Currently, the stock has broken out the rounding bottom pattern, which is a possible bullish sign.
 Daily Chart – NPTN
#2 Trading Above MAs: The stock is currently trading above both its 50-day and 200-day SMA, which implies that the bulls are currently in control.
#3 MACD Above Signal Line: In the daily chart, the MACD line (light blue color) is currently above the MACD signal line (orange color) which is typically considered bullish.
#4 Bullish Stoch: The %K line is above the %D line of the stochastic, indicating possible bullishness.
However, it is currently near overbought levels, indicating that a correction may occur before the next upmove.
#5 Bullish ADX and DI: The ADX line has started to move up from below –DI and +DI lines.
The +DI line as well as the ADX line are also currently above –DI line. This indicates possible bullishness.
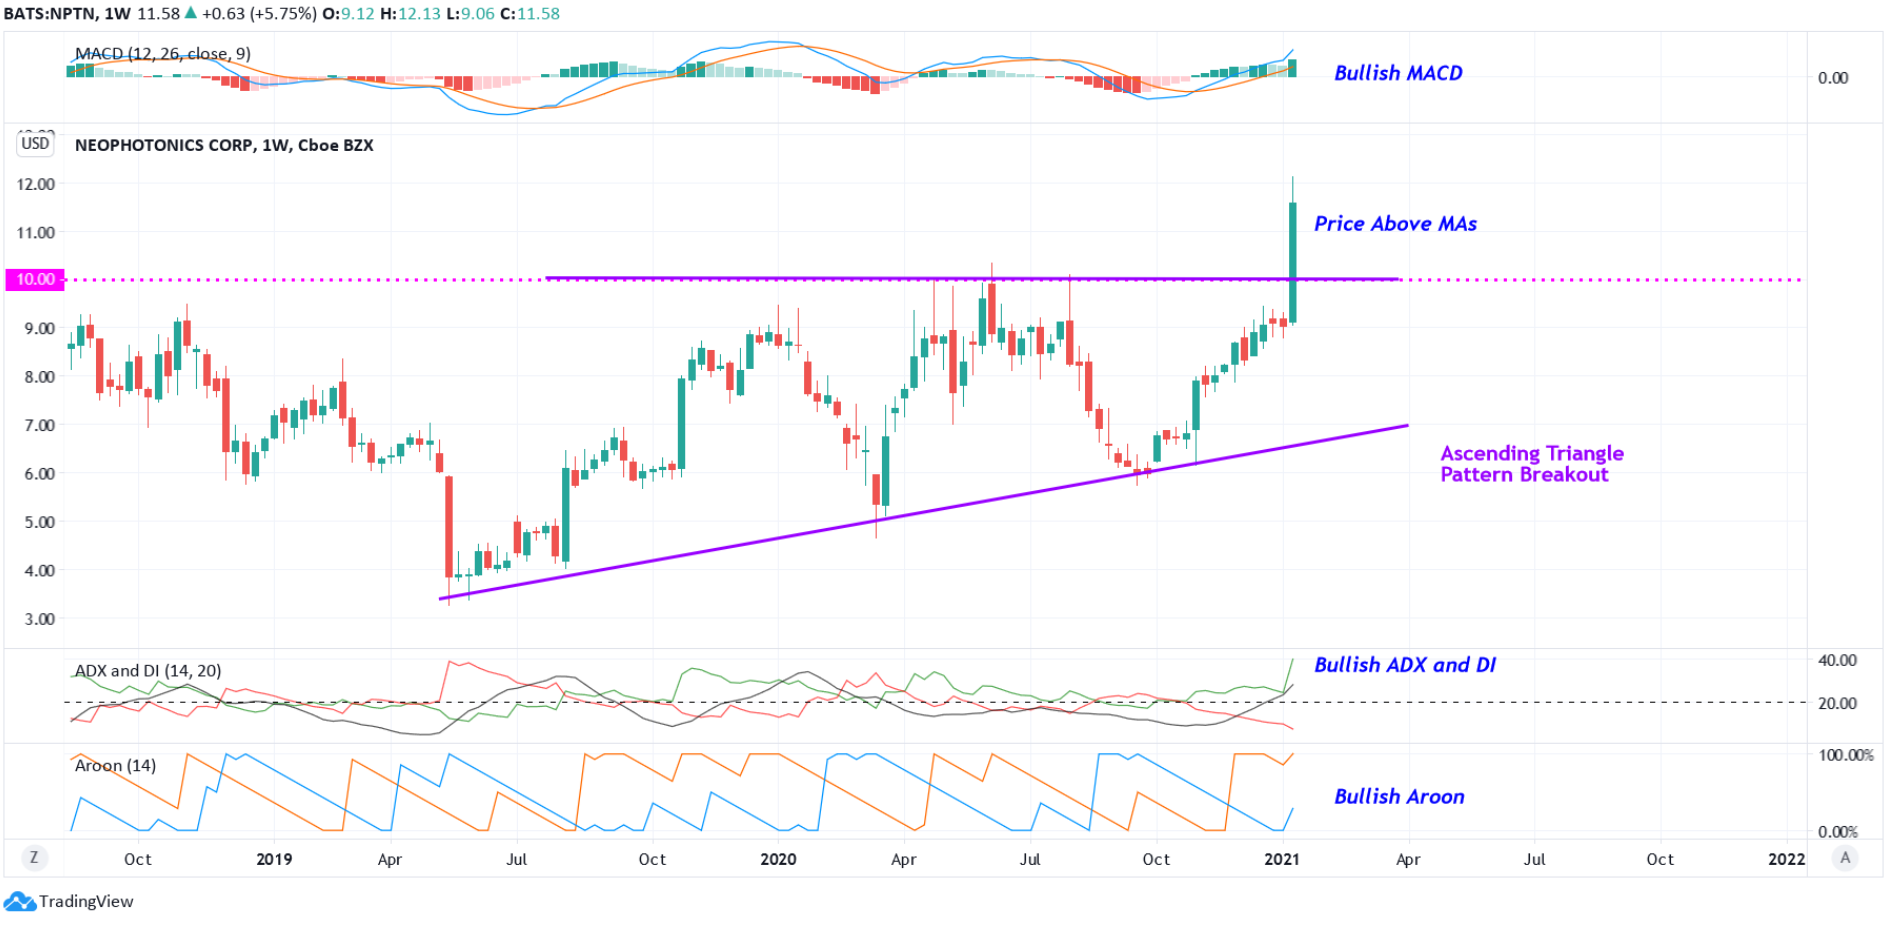
#6 Ascending Triangle Pattern Breakout: The weekly chart shows that the stock has broken out of an Ascending Triangle pattern. An Ascending Triangle pattern is a bullish pattern. This is marked on the daily chart in purple color. The breakout level of the ascending triangle pattern generally acts as a good support level.
 Weekly Chart – NPTN
#7 MACD Above Signal Line: In the weekly chart as well, the MACD line (light blue color) is currently above the MACD signal line (orange color). This is also a possible bullish sign.
#8 Price Above MAs: In the weekly chart as well, the stock is currently trading above both its 50-week and 200-week SMA, which implies that the bulls are currently in control.
Recommended Trade (based on the charts)
Buy Levels: If you want to get in on this trade, the ideal buy level of NTPN is if the stock corrects back to the breakout level of the ascending triangle pattern. This translates to a price of around $10.00. However, you can purchase half the intended quantity of shares of the stock above the price of $12.00.
TP: Our target prices are $14 and $18 in the next 3 to 5 months.
SL: To limit risk, place a stop loss around $7.30 (for entry near $10.00) and $10.70 (for entry near $12.00). Note that this stop loss is on a closing basis.
Our target potential upside is 16% to 80% in the next 3-5 months.
- Entry near $10: For a risk of $2.7, the target rewards are $4.00 and $8.00. This is a nearly 1:2 and 1:3 risk-reward trade.
- Entry near $12: For a risk of $1.30, the target rewards are $2.00 and $6.00. This is a nearly 1:2 and 1:5 risk-reward trade.
In other words, this trade offers nearly 2x to 5x more potential upside than downside.
Risks to Consider
The stock may reverse its overall trend if it breaks down with high volume from the ascending triangle breakout level. The sell-off of the stock could also be triggered in case of any negative news, overall weakness in the market, or any regulatory changes in its sector.
Happy Trading!
Tara
