
While the broader stock market indices remain anywhere from 5% – 10% or more off their February highs, some stocks are showing notable relative strength.
One such name is Netflix (NASDAQ:NFLX), which at present offers traders and investors both a structurally bullish idea and displays bullish behavior with breakout potential on the price charts.
Over the course of my career as a trader and investor I have adopted a multi-pillar approach to the markets.
That is, understanding that neither fundamentals alone nor glancing at a chart in isolation is a sustainable way for stock market profits over time.
My three pillars are the following: fundamental, technical (chart), and structural. Fundamentals take a company’s balance sheet, income statement, and growth potential into account. Technical analysis is the analysis of price behavior on the chart, and structural analysis are near- to intermediate-term exogenous influences on a stock.
Let us now apply these three pillars to shares of Netflix.
Fundamental: In my eye while Netflix continues to show healthy growth, the rate of change of growth has notably slowed in recent quarters. Ultimately this could weigh on the stock or at least cap upside momentum.
Structural: The near-term structural factors that I view as positive for NFLX stock are largely focused on the increasing fears around the spread of the coronavirus. This has people spending more time at home in fear of congregating in public areas. This allows for more time to watch Netflix.
And finally, the technical analysis follows. Let’s look at some charts:
Netflix Stock Charts
 Source: TradingView
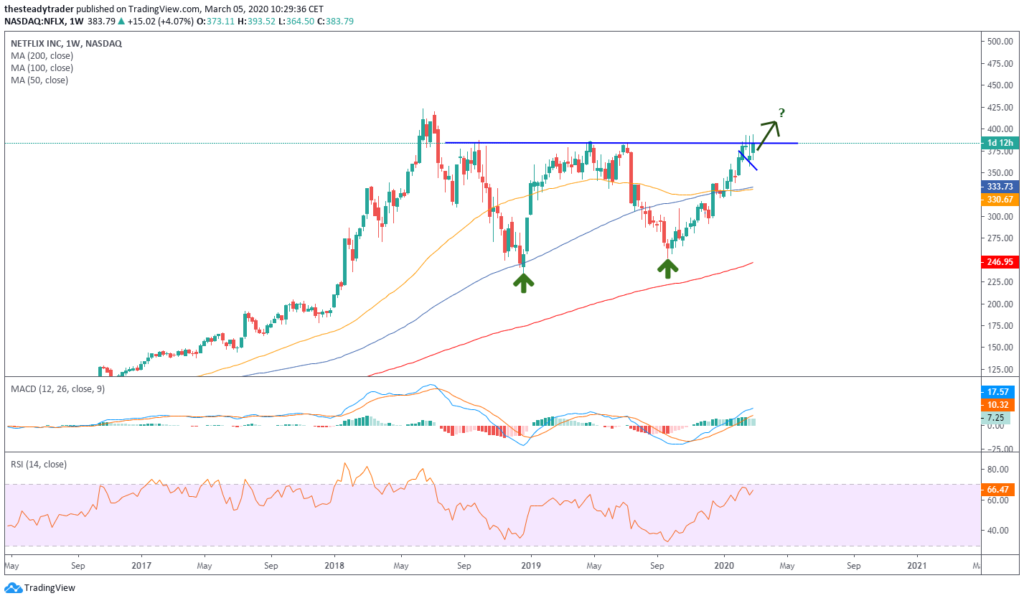
The multi-year chart with weekly increments shows that NFLX stock has notably underperformed the broader stock market over the past two years and remains below it’s all-time highs from 2018. Unlike the broader stock market, however, Netflix stock has remained strong over the past couple of weeks of market turbulence and now looks increasingly likely to push back up toward those 2018 highs.
Note also that in September 2019 the stock developed a marginally higher low versus its late 2018 low.
 Source: TradingView
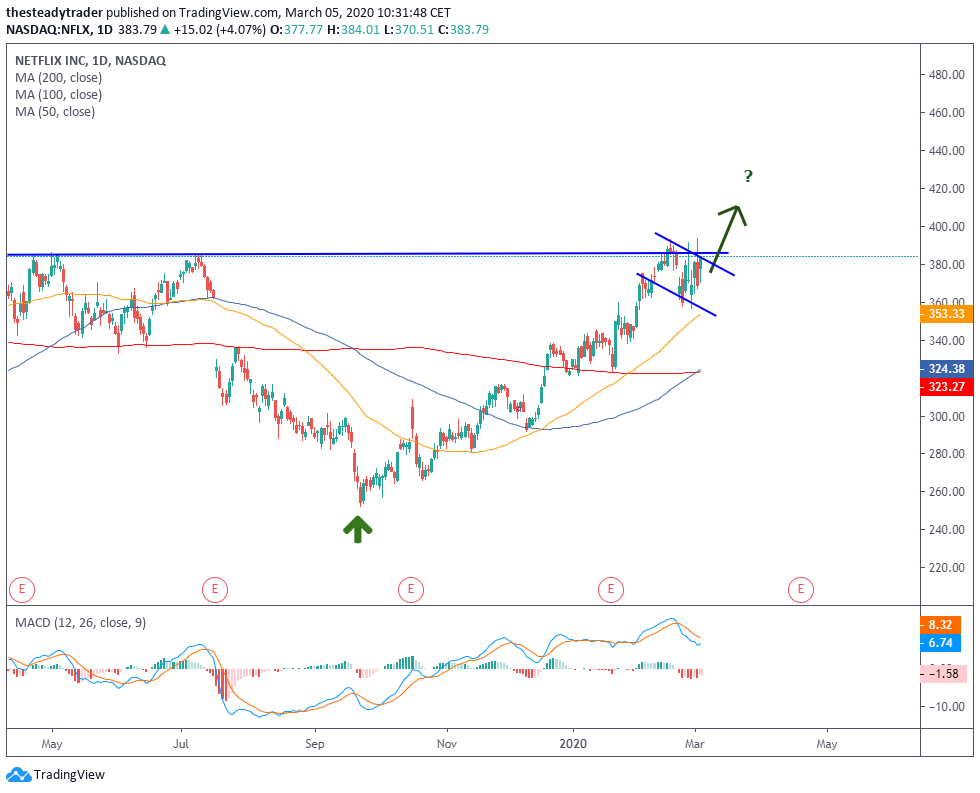
On the daily chart we see that in mid-February NFLX stock bumped into its 2019 highs in the high $380s. While the stock has traded in a choppy fashion since then, it has not melted down nearly as much as the broader market in a display of notable relative strength. In fact, the stock has consolidated orderly below the 2019 highs.
From here, the path of least resistance from a trading perspective in my eye is higher.
Trading NFLX Stock
Active traders and investors could look to buy Netflix stock around the $370 – $380 area with a next upside profit target around $400, possibly followed by $410.
As a stop loss, the $356 level serves as a well-defined level.
— Serge Berger
If you're buying rare earth or other critical mineral stocks, you're already one step behind - because we believe that political insiders in Washington are preparing to buy a whole new group of stocks, which could begin soaring 500%+ just days from now. The man once ranked in 2020 as America's #1 stock picker is doing something extraordinary and giving away the name and ticker of every single stock that could be next. Everything you need to know is here.
Source: Investor Place
