

“History doesn’t repeat itself, but it often rhymes.”
You’ve probably heard this aphorism before.
The past doesn’t tell us precisely what’s going to happen in the future.
However, the past can tell us what to roughly expect moving forward.
This dynamism between the past and the future is critical to keep in mind as an investor.
That could be said for all investment strategies.
But I think it might be especially true for dividend growth investing.
This is a strategy that advocates buying and holding shares in world-class enterprises that pay reliable, rising dividends.
The Dividend Champions, Contenders, and Challengers list highlights many of these enterprises.
A lengthy track record of growing dividends might not tell you exactly what will happen next year or the year after.
But it does tell you that you would be right to expect rhyming dividend raises to continue.
I’ve used these reliable rhymes to build up enough passive dividend income to live off of.
 Indeed, I’m financially independent and retired in my 30s.
I recount how I accomplished that in my Early Retirement Blueprint.
My FIRE Fund, which is my real-money dividend growth stock portfolio, generates the five-figure passive dividend income I need to pay my bills.
Of course, not all dividend growth stocks will reliably rhyme for you.
 And not all dividend growth stocks are great investments at all times.
Fundamental analysis, an examination of competitive advantages, risk assessment, and valuation are all highly important to setting baseline expectations.
The last piece – valuation – will have a lot to say about an investment’s performance.
While price is what you pay, value tells you what you get for your money.
An undervalued dividend growth stock should provide a higher yield, greater long-term total return potential, and reduced risk.
This is relative to what the same stock might otherwise provide if it were fairly valued or overvalued.
Price and yield are inversely correlated. All else equal, a lower price will result in a higher yield.
That higher yield correlates to greater long-term total return potential.
This is because total return is simply the total income earned from an investment – capital gain plus investment income – over a period of time.
Prospective investment income is boosted by the higher yield.
But capital gain is also given a possible boost via the “upside” between a lower price paid and higher estimated intrinsic value.
And that’s on top of whatever capital gain would ordinarily come about as a quality company naturally becomes worth more over time.
These dynamics should reduce risk.
Undervaluation introduces a margin of safety.
This is a “buffer” that protects the investor against unforeseen issues that could detrimentally lessen a company’s fair value.
It’s protection against the possible downside.
 Undervalued high-quality dividend growth stocks can change your life, as they’ve changed mine.
Fortunately, undervaluation is actually not that difficult to spot and take advantage of.
Fellow contributor Dave Van Knapp made that even easier through the introduction of Lesson 11: Valuation.
Part of an overarching and comprehensive series of “lessons” on dividend growth investing, Lesson 11 provides an easy-to-follow valuation template.
With all of this in mind, let’s take a look at a high-quality dividend growth stock that appears to be undervalued right now…
 Eastman Chemical Company (EMN)
Eastman Chemical Company (EMN) is a global specialty chemical company that manufactures and markets a wide range of advanced materials, chemicals, and fibers which are used in various consumer and industrial products.
The company operates across four segments: Additives & Functional Products, 36% of FY 2018 sales; Chemical Intermediates, 28%; Advanced Materials, 27%; and Fibers, 9%.
Sales by customer location broke down for FY 2018 as follows: United States and Canada, 42%; Europe, Middle East, and Africa, 27%; Asia Pacific, 25%; and Latin America, 6%.
Major end-use markets include Transportation, Consumables, and Building & Construction.
Originally founded in 1920, and later spun off from parent company Eastman Kodak Company (KODK) in 1994, the company now operates as one of the world’s largest specialty chemical companies.
Eastman Chemical has some kind of exposure to just about every industry you could think of, spread out across most major markets in the world.
Everyday end products that are a part of everyday life often require the advanced materials and chemicals that Eastman Chemical provides.
Think packaging, electronics, and personal care items.
History might not repeat itself exactly.
But unless the world suddenly stops turning, it’s very likely that society will continue to increasingly demand these finished products.
Those are the rhymes.
Dividend Growth, Growth Rate, Payout Ratio and Yield
And that increasing demand for end products should lead to the growing profit that allows for reliable, rising, and rhyming dividends.
As it sits, Eastman Chemical has increased its dividend for 10 consecutive years.
The 10-year dividend growth rate is a stout 11.1%.
This big dividend growth comes on top of a market-smashing yield of 3.76%.
 That yield is twice as high as what the broader market offers.
It’s also more than 100 basis points higher than the stock’s own five-year average yield.
Pairing a ~3.8% yield and an ~11% dividend growth rate sets you up for easy double-digit annual returns, assuming a static valuation.
And with a low payout ratio of 47.6%, Eastman Chemical is positioned to continue handing out rising dividends for years to come.
Adding to that strong position is the underlying growth at the business.
Of course, it’s ultimately future growth that matters most to investors.
We invest in where a company is going, not where it’s been.
Building out a future business growth trajectory is imperative in terms of building expectations for dividend growth.
It’s also imperative in terms of estimating the intrinsic value of the business.
Revenue and Earnings Growth
I’ll now build out a forward-looking trajectory, which will help us later value the stock.
I’ll first show you what Eastman Chemical’s top-line and bottom-line growth over the last decade.
And then I’ll compare that against a professional forecast for future profit growth.
Blending the proven past with a future forecast like this should tell us a lot about where the company might be going.
Eastman Chemical grew its revenue from $5.047 billion in FY 2009 to $10.151 billion in FY 2018.
That’s a compound annual growth rate of 8.07%.
I usually look for mid-single-digit top-line growth from most firms.
The company blew that out of the water.
Very strong sales growth here.
Keep in mind, though, that the starting point was negatively skewed by the effects of the Great Recession. This affects the growth rate.
Still, Eastman Chemical was a very profitable enterprise in FY 2009. That speaks volumes.
Meanwhile, earnings per share increased from $0.93 to $7.56 over this time frame, which is a CAGR of 26.22%.
Startling numbers for a chemicals company.
However, again, I do think the compressed numbers in FY 2009 provided something of a coiled spring for this company. They’ve rebounded very, very nicely.
Looking forward, CFRA is forecasting a 4% compound annual growth rate for Eastman Chemical’s EPS over the next three years.
That would be quite the drop from what’s transpired over the last decade.
It’s also materially lower than the 7% forecast that CFRA was printing as recently as August.
CFRA is balancing a slowing global economy against the fundamentally strong business.
A lot of major manufacturers have noted some slowdown in operations over the last 6-12 months. As manufacturing goes, so goes Eastman Chemical.
Economies around the world, particularly in developed countries, have been weak for some time now. Since Eastman Chemical is a global business that gets more than half of its sales outside of the US and Canada, they’re being impacted by this.
However, the US economy remains relatively strong. As long as that remains the case, the company is in a good position.
There very well could be a near-term drop in the company’s EPS growth. Recent quarters have shown this.
But the long-term, overall trajectory looks intact.
And even a 4% CAGR in EPS over the next three years, which would be a major slowdown, still sets up Eastman Chemical to deliver mid-single-digit dividend growth for the foreseeable future.
That’s by virtue of the low payout ratio.
The company could then resume even larger dividend raises once the global economy is more in sync.
Financial Position
Moving over to the balance sheet, Eastman Chemical maintains a solid financial position.
I wouldn’t say this position is excellent. But it’s not poor, either.
The long-term debt/equity ratio is 1.0, while the interest coverage ratio is over 6.
Treasury stock does make the former number look worse than it really is, since shareholders’ equity has been reduced.
Either way, I think the balance sheet could stand to be improved.
Fortunately, that’s exactly what Eastman Chemical has been doing.
Eastman Chemical reduced its long-term debt by almost 20% over the last five years. This was during a period in which a lot of companies were taking on debt to fuel buybacks. I commend Eastman Chemical for this.
Profitability is similar, in the sense that it’s both solid and improving.
Over the last five years, the company has averaged annual net margin of 10.26% and annual return on equity of 22.12%.
The last five years have been much better for profitability than the preceding five years.
Considering this is basically a commodity business, I think the profitability is rather strong.
There’s a lot to like about Eastman Chemical.
They have an enviable amount of diversification across geographies, chemicals, end-markets, and products.
It’s a highly profitable enterprise that is positioned to deliver ever-higher, rhyming dividends.
The company’s global scale, patent portfolio, technological know-how, and long-time relationships, provide it with durable competitive advantages.
Of course, there are risks to consider.
Competition, litigation, and regulation are omnipresent risks in every industry.
As a commodities business, they can be more of a price taker than a price maker.
Raw material and other input costs can be volatile, which causes fluctuations in cash flow.
And with the cyclical nature of manufacturing, the company is highly exposed to a global recession.
Overall, however, I think it’s a high-quality business.
Stock Price Valuation
At the right valuation, this could be a fantastic long-term investment.
Well, the valuation appears to be attractive right now…
The P/E ratio is sitting at a lowly 12.83.
That’s considerably less than where the broader market is at.
There’s also the P/S ratio of 1.0, which is lower than the stock’s own five-year average P/S ratio of 1.2.
The P/CF ratio, at 6.3, is significantly lower than the stock’s three-year average P/CF ratio of 8.3.
And the yield, as noted earlier, is currently much higher than its own recent historical average.
So the stock does look cheap. But how cheap might it be? What would a reasonable estimate of intrinsic value look like?
I valued shares using a dividend discount model analysis.
I factored in a 10% discount rate and a long-term dividend growth rate of 7%.
This DGR roughly splits the difference between the company’s long-term proven DGR (~11%) and the near-term forecast for EPS growth (4%).
With a low payout ratio, dividend raises could easily exceed EPS growth over the next few years.
That could put them near the 7% mark.
And then I’d expect the business to rebound, which would push the dividend growth potential over the 7% mark.
I’m averaging things out there, but Eastman Chemical looks to be in a comfortable position to deliver this kind of dividend growth for the long term.
The DDM analysis gives me a fair value of $94.16.
The reason I use a dividend discount model analysis is because a business is ultimately equal to the sum of all the future cash flow it can provide.
The DDM analysis is a tailored version of the discounted cash flow model analysis, as it simply substitutes dividends and dividend growth for cash flow and growth.
It then discounts those future dividends back to the present day, to account for the time value of money since a dollar tomorrow is not worth the same amount as a dollar today.
I find it to be a fairly accurate way to value dividend growth stocks.
This was not an aggressive valuation. Yet the stock still looks cheap.
But we’ll now compare that valuation with where two professional stock analysis firms have come out at.
This adds balance, depth, and perspective to our conclusion.
Morningstar, a leading and well-respected stock analysis firm, rates stocks on a 5-star system.
1 star would mean a stock is substantially overvalued; 5 stars would mean a stock is substantially undervalued. 3 stars would indicate roughly fair value.
Morningstar rates EMN as a 4-star stock, with a fair value estimate of $91.00.
CFRA is another professional analysis firm, and I like to compare my valuation opinion to theirs to see if I’m out of line.
They similarly rate stocks on a 1-5 star scale, with 1 star meaning a stock is a strong sell and 5 stars meaning a stock is a strong buy. 3 stars is a hold.
CFRA rates EMN as a 3-star “HOLD”, with a 12-month target price of $76.00.
I came out right about where Morningstar did. Averaging the three numbers out gives us a final valuation of $87.05, which would indicate the stock is possibly 23% undervalued.
 Bottom line: Eastman Chemical Company (EMN) is a high-quality company with an enviable amount of diversification across geographies, end-markets, and products. With a yield that’s twice as high as the broader market, double-digit long-term dividend growth, a low payout ratio, a decade of dividend raises, and the potential that shares are 23% undervalued, this is a stock that all dividend growth investors should take a closer look at right now.
-Jason Fieber
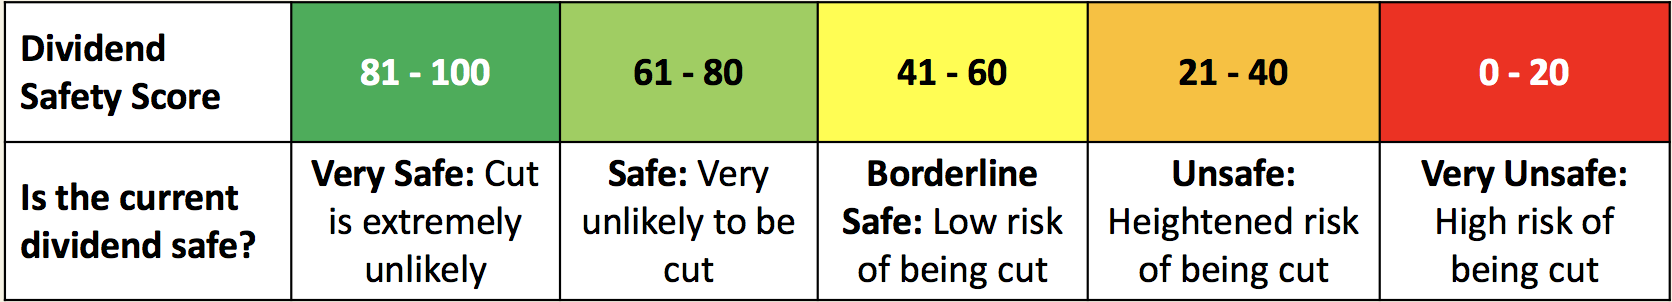
Note from DTA: How safe is EMN’s dividend? We ran the stock through Simply Safe Dividends, and as we go to press, its Dividend Safety Score is 85. Dividend Safety Scores range from 0 to 100. A score of 50 is average, 75 or higher is excellent, and 25 or lower is weak. With this in mind, EMN’s dividend appears Very Safe with an extremely unlikely risk of being cut. Learn more about Dividend Safety Scores here.
I recently visited Mar-a-Lago... And now I'm prepared to put my reputation on the line. Since 1998, my proprietary system would've returned 13,126% in backtests. (That's 13X the S&P and 106X the average investor, according to JP Morgan.) However, one investment I just uncovered could be my biggest winner of all... It involves President Trump, Elon Musk, trillions of dollars, China... And a MAJOR upgrade to the artificial intelligence revolution. See for yourself!
