

It’s clear that technology is rapidly changing our world.
AI. The Internet. Smartphones. Robots. Cloud computing.
The list goes on.
When there’s something this obvious, investors must take advantage.
However, they must also be prudent and select the right opportunities.
How do we do that?
Well, I’d argue that finding the right opportunities is much easier when you’re using the right strategy.
Select the strategy. Then find the best stocks within that strategy.
In my experience, there’s no strategy better than dividend growth investing.
It’s an amazing long-term investment strategy for building wealth and passive income.
This strategy advocates buying and holding shares in world-class enterprises that pay shareholders reliable and rising dividends.
I personally used this strategy to go from below broke at 27 years old to financially free and retired at 33.
 I lay out exactly how I did that in my Early Retirement Blueprint.
Suffice to say, I lived below my means and invested my hard-earned capital into the right opportunities.
And I built the FIRE Fund in the process.
That’s my real-money dividend growth stock portfolio.
It generates the five-figure passive dividend income I live off of.
 Many of the right opportunities can actually be found on the Dividend Champions, Contenders, and Challengers list.
That list contains invaluable data on more than 800 US-listed stocks that have raised dividends each year for at least the last five consecutive years.
However, it’s definitely not as simple as picking any dividend growth stock.
You have to pick the best stocks within the strategy.
Fundamental analysis is critical.
So is valuation.
While price is what you pay, it’s value that you get.
An undervalued dividend growth stock should provide a higher yield, greater long-term total return potential, and reduced risk.
This is relative to what the same stock might otherwise provide if it were fairly valued or overvalued.
Price and yield are inversely correlated. All else equal, a lower price will result in a higher yield.
That higher yield correlates to greater long-term total return potential.
This is because total return is simply the total income earned from an investment – capital gain plus investment income – over a period of time.
Prospective investment income is boosted by the higher yield.
But capital gain is also given a possible boost via the “upside” between a lower price paid and higher estimated intrinsic value.
And that’s on top of whatever capital gain would ordinarily come about as a quality company naturally becomes worth more over time.
These dynamics should reduce risk.
Undervaluation introduces a margin of safety.
 This is a “buffer” that protects the investor against unforeseen issues that could detrimentally lessen a company’s fair value. It’s protection against the possible downside.
Selecting the right opportunities at the right valuation could lead to a tremendous amount of wealth and passive income for an investor.
Fortunately, the valuation aspect isn’t that difficult to figure out.
Fellow contributor Dave Van Knapp has made it easier than ever, even providing readers with an easy-to-follow valuation template.
He did that with Lesson 11: Valuation, which is part of an overarching series of “lessons” on dividend growth investing.
With all of this in mind, let’s take a look at a high-quality dividend growth stock that appears to be undervalued right now…

Broadcom Inc. (AVGO)
Broadcom Inc. (AVGO) — the latest purchase in DTA’s Income Builder Portfolio — is a leading designer, developer, and supplier of analog and digital semiconductor devices.
The company reports revenue in two primary segments: Semiconductor Solutions, 77% of FY 2019 sales; Infrastructure Software, 23%.
Broadcom has been built through a series of large mergers and acquisitions. This M&A activity has formed one of the largest semiconductor companies in the world, with Broadcom sporting a market cap north of $122 billion.
Their solutions can be found in smartphones, servers, set-top boxes, storage systems, and controllers.
Broadcom is heavily exposed to data centers, broadband, wireless connectivity, and automation.
In fact, you’d be hard-pressed to name a major theme in technology that Broadcom isn’t exposed to.
Investing in Broadcom is investing in the future of the Internet and how people work and communicate with one another.
Said another way, investing in Broadcom is investing in the future.
As we continue to shift toward a more connected world, Broadcom stands to do incredibly well. They manufacture the solutions that facilitate this shift.
This bodes well for Broadcom.
Dividend Growth, Growth Rate, Payout Ratio and Yield
It also bodes well for their ability to pay a growing dividend.
As it sits, the company has increased its dividend for 10 consecutive years.
What they might lack in terms of a lengthy track record, they more than make up for in terms of the size of the dividend increases.
Check it out.
The five-year dividend growth rate is an astounding 55.5%!
Even the most recent dividend increase, announced back in December, was over 22%.
This is a dividend growth juggernaut.
And that growth comes on top of a mouth-watering yield of 4.15%.
 That yield is more than twice as high as what the broader market offers.
It’s also almost 200 basis points higher than the stock’s own five-year average yield.
This yield is backed by a 61.1% payout ratio (based on FY 2019 adjusted EPS).
A bit elevated, yes, but I think that’s because the dividend growth has been so astounding.
I expect the dividend growth to slow down markedly from here, in part because the payout ratio has climbed.
However, the starting yield is quite high. Even a forward-looking dividend growth rate that is half of what they’ve been cooking up would be very appealing.
Revenue and Earnings Growth
Let’s now take a look at those forward-looking projections.
After all, we invest in where a company is going, not where it’s been.
I’m going to show you what Broadcom has done over the last decade in terms of top-line and bottom-line growth.
Then I’ll compare those numbers to a near-term professional forecast of profit growth.
Blending the proven past with a future forecast in this way should allow us to extrapolate future growth and build out a trajectory.
Broadcom grew its revenue from $2.093 billion in FY 2010 to $22.597 billion in FY 2019.
That’s a compound annual growth rate of 30.26%.
Stellar growth, obviously. Really impressive stuff.
Much of this was not organic, though.
As mentioned earlier, Broadcom has been involved in serial M&A activity, building the technology behemoth that now exists.
A recent example of this is the $18.9 billion acquisition of CA Technologies, which was one of the largest independent software companies in the world.
Looking at growth on a per-share basis should give us a better idea of how this non-organic growth has been shaping up for the company, and whether or not it was accretive.
Earnings per share has increased from $1.69 to $21.29 (adjusted) over this period, which is a CAGR of 32.51%.
Again, really impressive. These are jaw-dropping numbers.
I will note that I used adjusted EPS for FY 2019 because of the numerous adjustments that artificially skewed GAAP EPS to the point of it basically being unusable.
The outstanding share count has almost doubled over the last decade; however, revenue is up by a factor of 10, so there’s nothing to complain about in that department.
Looking forward, CFRA is anticipating for Broadcom to compound its EPS at an annual rate of 12% over the next three years.
They cite the growth runway in 5G, the shift to higher-margin infrastructure software (relating back to the CA Technologies acquisition), and higher spending in cloud as key tailwinds.
On the other hand, a concentrated customer mix and the volatile nature of electronics are areas of concern.
I think this is a fair growth assessment.
Broadcom’s more recent reports have shown some slowing down in adjusted numbers, and the law of large numbers means they just can’t continue to M&A their way to bigger numbers. Much of their success from here will rely on organic growth from the assemblage of related technology businesses they’ve built.
Even a 12% CAGR in EPS offers a lot to like, though.
That certainly paves the way for low-double-digit dividend growth.
And pairing that with a 4%+ yield gets you to double-digit total return potential very, very quickly.
If you can get all of that on top of a low valuation, creating some additional upside on a multiple expansion, you have a home run.
Financial Position
Moving over to the balance sheet, this is probably the only area of the business that concerns me.
It’s not that Broadcom is in any kind of dire straits; rather, it’s just that there’s been a lot of debt taken on as a consequence of all of that M&A activity. The balance sheet has been somewhat stretched in the process.
The long-term debt/equity ratio is 1.20, while the interest coverage ratio is under 3.
The former number isn’t a problem. The latter number looks worse than it is because of all of the aforementioned adjustments to GAAP earnings.
I suspect earnings will normalize soon. Furthermore, I think Broadcom will soon start to redirect some of their immense free cash flow prowess to knocking down some debt.
This might create some competition for cash flow and how that impacts dividend raises, but I think the effects will be minor.
Profitability, as you might expect, is robust.
Over the last five years, Broadcom has averaged annual net margin of 17.44% and annual return on equity of 18.17%.
Very good numbers. But I think they belie the true potential of Broadcom.
The last few years have been messy. Once the company starts to relax and smooth out the numbers, the net margin in particular should improve off of this average.
Broadcom has positioned itself fantastically in a number of key areas as they relate to where the world is moving with technology.
The 5G revolution alone looks like it’s going to change the very nature of our lives. And Broadcom is going to be a key player in this massive transition in the way mobility, communications, and wireless are all used.
Patents, expertise, scale, essential technologies, are some of the firm’s durable competitive advantages.
Of course, there are risks to consider.
Litigation, regulation, and competition are omnipresent risks in every industry.
Broadcom’s balance sheet has been stretched as it’s gone after a multitude of deals. This limits their flexibility.
There’s also customer and product concentration. Approximately 25% of the company’s revenue comes from Apple Inc. (AAPL). Moreover, almost 1/3 of the company’s revenue is from the smartphone space.
Demand for electronics is economically sensitive.
Lastly, technology changes fast. If Broadcom isn’t constantly innovating, they run the risk of falling behind.
Stock Price Valuation
At the right valuation, though, this stock could be one of the best long-term opportunities out there.
Well, the valuation looks very attractive right now…
The P/E ratio is 14.66, based on adjusted EPS for FY 2019.
This is clearly well below that of the broader market, although I’m admittedly using an adjusted EPS number for Broadcom’s stock.
Even if we remove the messiness of EPS and focus on cash flow alone, the P/CF ratio of 13.5 is well off of the stock’s own three-year average P/CF ratio of 15.6.
And the yield, as shown earlier, is significantly higher than its recent historical average.
So the stock does look cheap. But how cheap might it be? What would a reasonable estimate of intrinsic value look like?
I valued shares using a dividend discount model analysis.
I factored in a 10% discount rate and a long-term dividend growth rate of 7%.
This is a cautious DGR when we look at what Broadcom has done in recent years.
But the payout ratio has expanded. And I think things will slow since the company is now so large and will have to rely more on organic growth moving forward.
The CFRA EPS growth forecast would easily allow for low-double-digit dividend growth. I’m erring on the side of caution here because I think Broadcom will also have to take better care of the balance sheet over the long run.
The company has room to easily outpace my projection. But I’d rather set the bar low and let the company exceed expectations.
The DDM analysis gives me a fair value of $463.67.
The reason I use a dividend discount model analysis is because a business is ultimately equal to the sum of all the future cash flow it can provide.
The DDM analysis is a tailored version of the discounted cash flow model analysis, as it simply substitutes dividends and dividend growth for cash flow and growth.
It then discounts those future dividends back to the present day, to account for the time value of money since a dollar tomorrow is not worth the same amount as a dollar today.
I find it to be a fairly accurate way to value dividend growth stocks.
Even with a very conservative valuation, the stock looks outrageously cheap right now.
But we’ll now compare that valuation with where two professional stock analysis firms have come out at.
This adds balance, depth, and perspective to our conclusion.
Morningstar, a leading and well-respected stock analysis firm, rates stocks on a 5-star system.
1 star would mean a stock is substantially overvalued; 5 stars would mean a stock is substantially undervalued. 3 stars would indicate roughly fair value.
Morningstar rates AVGO as a 3-star stock, with a fair value estimate of $310.00.
CFRA is another professional analysis firm, and I like to compare my valuation opinion to theirs to see if I’m out of line.
They similarly rate stocks on a 1-5 star scale, with 1 star meaning a stock is a strong sell and 5 stars meaning a stock is a strong buy. 3 stars is a hold.
CFRA rates AVGO as a 5-star STRONG BUY, with a 12-month target price of $400.00.
I came out high. But I also think Morningstar’s number is way too low. the three numbers out gives us a final valuation of $391.22, which would indicate the stock is possibly 25% undervalued.
 Bottom line: Broadcom Inc. (AVGO) is a high-quality company that is perfectly positioned in a number of key areas of technology. With a market-smashing 4%+ yield, a massive 50%+ five-year dividend growth rate, a moderate payout ratio, and the potential that shares are 25% undervalued, this looks like the right kind of opportunity in this market.
-Jason Fieber
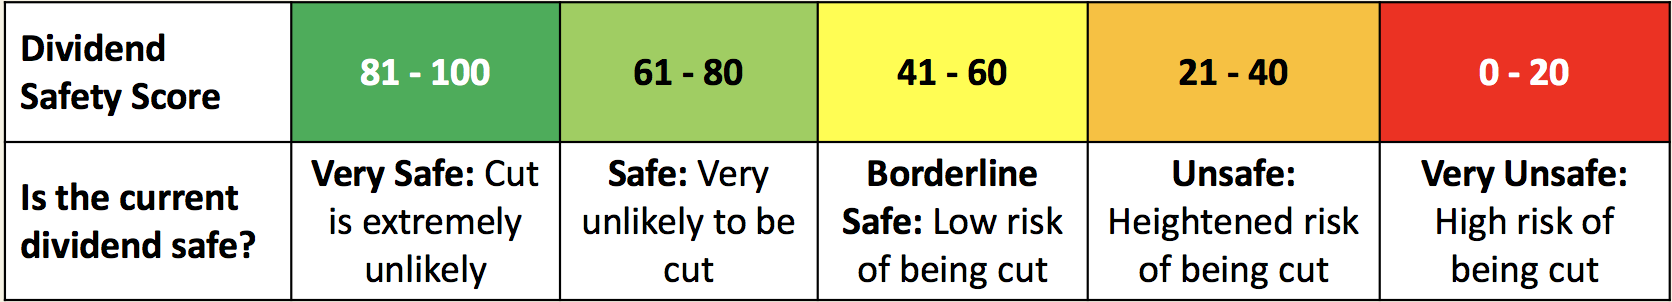
Note from DTA: How safe is AVGO’s dividend? We ran the stock through Simply Safe Dividends, and as we go to press, its Dividend Safety Score is 67. Dividend Safety Scores range from 0 to 100. A score of 50 is average, 75 or higher is excellent, and 25 or lower is weak. With this in mind, AVGO’s dividend appears Safe with a very unlikely risk of being cut. Learn more about Dividend Safety Scores here.
I recently visited Mar-a-Lago... And now I'm prepared to put my reputation on the line. Since 1998, my proprietary system would've returned 13,126% in backtests. (That's 13X the S&P and 106X the average investor, according to JP Morgan.) However, one investment I just uncovered could be my biggest winner of all... It involves President Trump, Elon Musk, trillions of dollars, China... And a MAJOR upgrade to the artificial intelligence revolution. See for yourself!
