

You’ve heard the old saying, “what goes up must come down.”
This is true for many things – but especially true for the stock market.
At the same time though, when it comes to the market, what goes down typically comes back up.
And the key to your profits is playing these changes in momentum just right.
Here’s how to do that…
Using Momentum to Capture Your Next Triple-Digit Gains
Have you ever fired off bottle rockets?
If so, you know that they move up until they run out of fuel and then lose momentum before returning back to earth. These rockets are driven by momentum, and once the momentum slows, the rocket begins it descent.
And similar to bottle rockets, this is also true for stocks.
Strong stocks begin a bullish run and increase upside momentum as they rise.
The weakest of stocks begin a bearish run and increase downside momentum as they fall.
But we know nothing goes up or down forever…
At some point in the rise and fall of these high-momentum movers, the momentum slows and the stocks gradually turn the other way… sometimes with as much momentum as they had getting there.
It’s important to note that momentum slows before direction does. Detecting these momentum shifts before the price moves the other way can lead to big profits. This is particularly true for volatile stocks like we talked about in my recent Average True Range article.
Fortunately, there is a great way to detect these stocks…
I’m talking about stochastics.
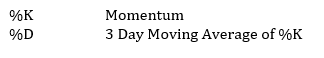
The stochastics oscillator was developed in the late 1950s by George Lane and has been one of the most popular technical indicators since. The basic idea is that stocks in an uptrend tend to close near their highs and vice versa. Stochastics detects these conditions using two lines:
The following graph illustrates stochastics on Tesla Inc. (NASDAQ: TSLA), a big moving stock.
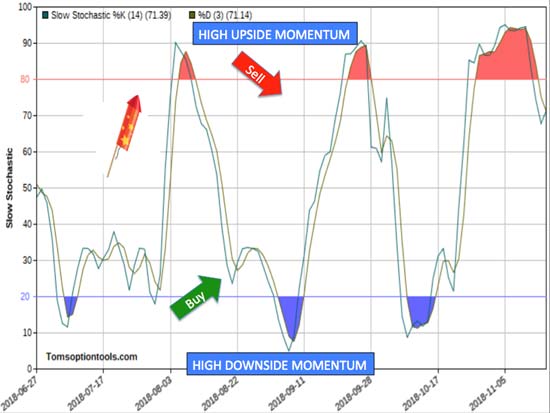
%K is indicated on a scale of 0–100. Bullish-trending stocks with a reading above 80 are considered to have high upside momentum. Bearish-trending stocks with a reading below 20 are considered to have high downside momentum.
So, here’s how you use it…
When the %D crosses below the 80 line, upside momentum has dried up, signaling a bearish move. When the %D crosses above the 20 line, downside momentum has dried up, signaling a bullish move.
The TSLA chart below illustrates this:
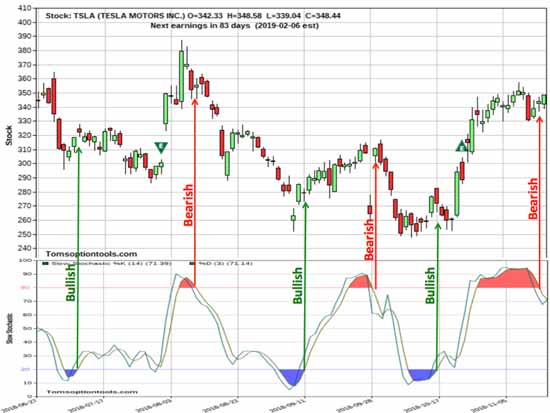
Four of the first five signals successfully called nice moves. The last signal on the right has yet to come to fruition. As with all indicators, it’s important to note that they don’t always call it correctly – no indicator does.
Now, I just scanned the market for the best slowing momentum stocks in the S&P 500 and found that there was only one bullish reversal and many bearish reversals. This may be an indication of further downside in the market, so be ready!
Here are my top 20 S&P 500 stocks that have stochastic readings that just broke below 80, signaling potential bearish runs…
![]()
You’ll see above that these stocks have moved up strongly and are poised for a potential correction – which sets up a perfect opportunity for your profits.
— Tom Gentile
Source: Money Morning
