

“Human nature never changes…”
“History repeats itself…”
These adages stick around because they’re true.
They’re even true in the markets. The ups and downs of the market are nothing more than the graphic representation of human behavior… expressed on a chart of buyers and sellers. And this market behavior tends to repeat.
That’s how technical analysis works. We know what’s happening because we’ve seen this all happen before.
Today, I’ll explain more about how we can use this to our advantage as investors…
Here is a perfect example of a type of technical analysis that warned of a storm brewing at the start of 2007… WELL before the market crashed in the financial crisis.
It’s called “intermarket analysis.”
This idea is based on correlations between asset classes. When one of these asset classes turns down, it may be a warning sign for other asset classes (in this case, stocks).
We know this, because these chart patterns have shown up before, and those other assets have fallen.
Take a look at this chart. It shows the relationship between the S&P 500 Index (in black) and U.S. 30-year interest rates (in blue), right before the financial crisis…
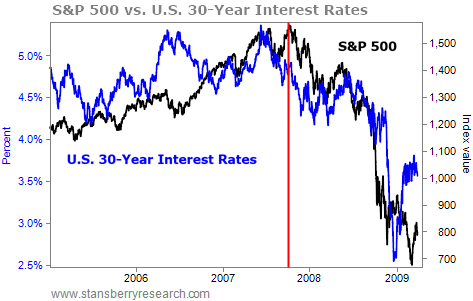 The S&P 500 and U.S. 30-year interest rates traded in tandem for much of the early 2000s – then, in late 2007, the correlation broke down. Interest rates started to turn down – a sign of a slowing economy.
Look at the red line…
See how stocks made new highs, while interest rates failed to? That was a warning that something was wrong.
Of course, most of the fundamental analysts at the time pointed to strong earnings and solid “fundamentals.”
The ultimate fundamentalist – former Federal Reserve Chairman Ben Bernanke – proclaimed around this time that the effects of “the subprime sector on the broader housing market will be limited and we do not expect significant spillovers from the subprime market to the rest of the economy or to the financial system.”
You know what happened next.
This is the essence of technical analysis – understanding the behavior of markets and history. This concept is lost on many investors, who simply write it off. They just don’t understand and aren’t willing to put in the necessary time and effort.
Technical analysis is much more than trendlines and charts. It is understanding the past to profit in the future.
I will be honest…
It took me a while to grasp technical analysis, too. But time and time again, I’ve witnessed how well it works.
I want you to see much more than the trendlines and patterns, and understand that we are studying the behavior of market participants… We are learning from history.
And to do this, we don’t need to speculate about the reasons behind the behavior. We don’t need to worry about fundamentals.
There’s nothing wrong with wanting to know WHY a certain stock will move… But I am much more concerned with WHEN that stock will move and WHAT the price will do (i.e. how much it will go up or down).
And think about what really matters in investing – WHEN you buy and WHEN you sell. The WHY is less important when it comes down to the goal of investing: Did you make or lose money?
That’s all that matters.
Perhaps the greatest value in technical analysis is that it is both a trading strategy and a risk-management system wrapped into one. It shows us opportunities – and warnings. And it keeps us focused on making and preserving wealth.
If you’re like most people, this is most likely a brand-new way to look at the market. So it’s going to take some time to get used to.
But once you understand the basics, I promise you’ll begin to invest in an entirely new way.
Good investing,
Greg Diamond
I recently visited Mar-a-Lago... And now I'm prepared to put my reputation on the line. Since 1998, my proprietary system would've returned 13,126% in backtests. (That's 13X the S&P and 106X the average investor, according to JP Morgan.) However, one investment I just uncovered could be my biggest winner of all... It involves President Trump, Elon Musk, trillions of dollars, China... And a MAJOR upgrade to the artificial intelligence revolution. See for yourself!
Source: Daily Wealth
