
Two weeks ago, I told you to buy natural gas.
The price of natural gas had fallen to a 17-year low. It was oversold. And the chart showed that it was poised for a bounce.
We’ve gotten that bounce. Now, it’s time to take profits…
Take a look at this updated chart of natural gas…
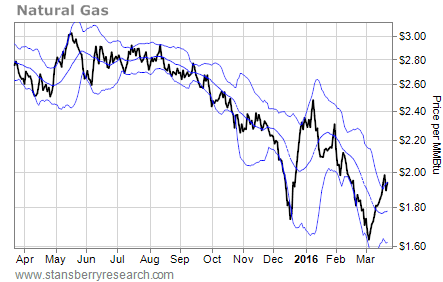 After bottoming at $1.62 per million British thermal units (MMBtu) earlier this month, the price of natural gas rallied all the way back up to $1.93 per MMBtu. That’s a 19% gain in a little more than two weeks.
[ad#Google Adsense 336×280-IA]The bounce fell a bit shy of the $2.10 target I was originally looking for.
But it’s close enough.
Now, with the price of natural gas bumping into the resistance line of its upper Bollinger Band – which defines the normal trading range for prices – it’s time to take profits on the trade.
If you made this trade by buying shares of the United States Natural Gas Fund (UNG), you’re sitting on similar gains… and it’s time to take profits on that trade, too.
Look at the one-year chart of UNG…
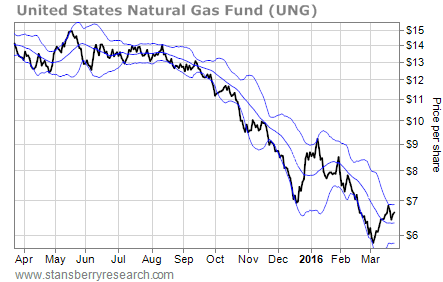 UNG has rallied from its low of about $5.80 per share in early March to a recent high of $6.90. That’s a 19% move in about two weeks.
Now, just like the price of natural gas, UNG is trading near its upper Bollinger Band. That’s likely to keep a lid on the share price in the short term.
The best result that traders can hope for at this point is for UNG to chop back and forth in a consolidation pattern while the stock builds energy for another move higher. The worst case would be for UNG to drop back down toward its lower Bollinger Band and retest the low that it established about two weeks ago.
Either way, there’s no reason for traders to sit through that action.
Take the gains on natural gas now. We’ll likely have a chance to get back into this trade at lower prices within the next few weeks.
Best regards and good trading,
Jeff Clark
[ad#stansberry-ps]
Source: Growth Stock Wire
