
Coffee may finally be breaking out to the upside.
The price of coffee has rallied more than 10% in the past two months. And it looks like this is just the beginning of a much larger move higher.
There’s one easy way for investors to take advantage of the breakout…
Take a look at the 18-month chart of coffee prices…
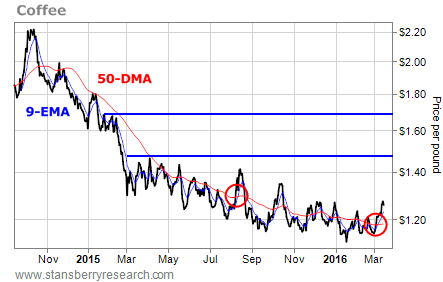 As you can see, coffee is now trading above both its nine-day exponential moving average (EMA) and its 50-day moving average (DMA). And the nine-day EMA recently completed a “bullish cross” above the 50-DMA.
This is usually an intermediate-term bullish sign.
Coffee should now be headed higher toward the next resistance line at about $1.48.
Of course, we’ve seen plenty of false breakouts in coffee since the chart showed a similar setup in August.
But last week’s move higher is supported by a clear breakout on the weekly chart…
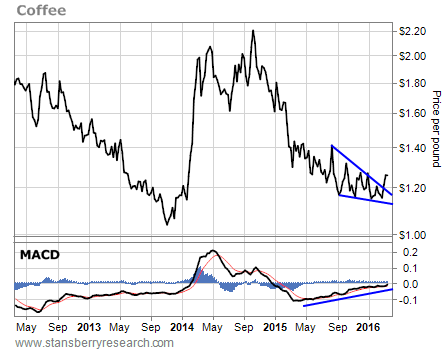 This chart shows a falling-wedge pattern with positive divergence on the moving average convergence divergence (MACD) momentum indicator.
As you can see, coffee broke out of the pattern last week.
It’s not uncommon for a chart to come back down and retest the breakout levels on this sort of pattern. So coffee may have some weakness in the short term.
But over the next several weeks, it looks like coffee is headed even higher.
The easiest way to take advantage of coffee’s move higher is through the iPath Bloomberg Coffee Subindex Total Return Fund (JO). This exchange-traded note (“ETN”) uses the futures market to track the performance of the price of coffee.
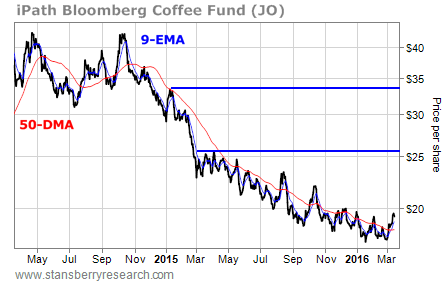 As you can see in the chart above, JO broke above both of its moving average lines last week. Its next resistance level is up around $26 per share. That’s a 30%-plus gain from its closing price earlier this week.
But if the coffee rally really gets going, we could see JO trading at more than $30 within the next few months – a potential 55% gain.
Best regards and good trading,
Jeff Clark
[ad#stansberry-ps]
Source: Growth Stock Wire
