
Telling someone to sit tight amidst volatility is one thing. Getting them to listen to this time-proven advice is another thing entirely.
And believe me, I don’t kid myself.
[ad#Google Adsense 336×280-IA]I know many of our readers, despite my pleading, sold all or most of their holdings near one of the many bottoms we have seen since the beginning of January.
But I am going to pound the table one more time to try to save a few of us from ourselves.
This time though, I am going to show you in hard numbers how you are flushing your retirement down the toilet by panic-selling and trying to time the markets.
And, yes, selling when you’re fearful and buying when it looks like the Dow is going to 25,000 are just two forms of market timing. (You’ll see why in a minute.)
If you didn’t already know it, most of the stock market’s returns happen in just a handful of days in a decade. If you miss them, you miss most or all of the returns. The chart below shows how much you would have lost if you had missed just the 25 best days in the market of the last 45 years.
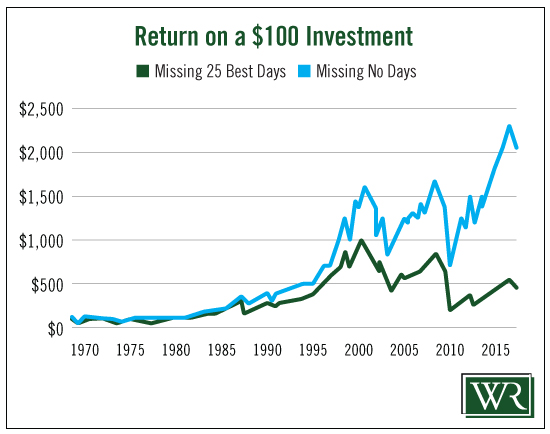
It’s staggering. Removing just 25 of the 11,620 total days of the past 45 years drops the annual return from 6.7% to 3.4% – and drops the total return from 1,910% to 341%.
If you’re frequently jumping in and out of the market, there’s a good chance you missed all or most of the top 25. (How you unknowingly did this to yourself will be clearer in a minute.)
Now, the other side of the timing fallacy: the worst days. Here’s a comparison of what your returns would have looked like if you had somehow managed to miss the market’s worst days over the past 45 years:
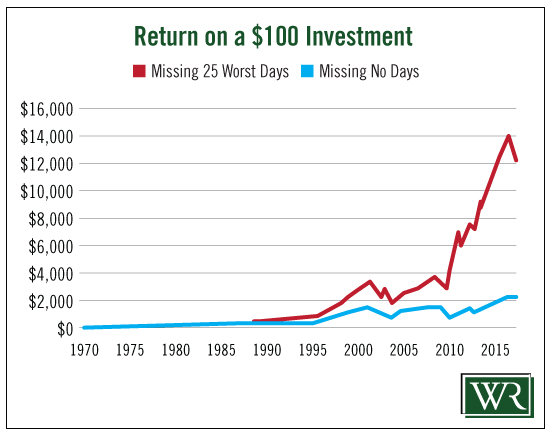
As the chart demonstrates, if you had magically missed the market’s worst days since 1970, your returns would have exceeded 12,000%.
Completely unrealistic, I know. No one can guess which will be the 25 best days and they certainly can’t guess which will be the worst days.
In my experience, it’s realistic to expect the little guy to sell during or immediately after the worst days. That’s when fear gets out of control and they think crazy things like “I’ll lose it all.”
(How crazy that is will also be very clear, very soon.)
Now I want to show you what happens when you leave out both the 25 best and the 25 worst days. That’s a little more reasonable – or, at least, enables a more balanced expectation for your investments. But it also demonstrates what riding out the market craziness – and not timing on either extreme – has done for us since 1970.
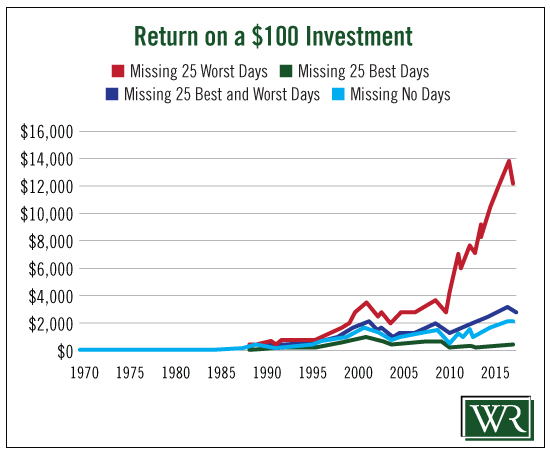
The dark blue line represents what would have happened had you avoided the best and worst days. It returned 2,750%.
The light blue line, showing the returns from sticking it out through all the days, good and bad, returned 1,910%. Yes, by riding it out you didn’t make as much as you would have had you pulled off the impossible and avoided all the spikes, up and down.
But based on my 25 years of experience with small investors, even hitting the light blue line is impossible for most folks. They refuse to accept the fact that jumping in and out of the market is a losing proposition. In the back of everyone’s mind, they still believe they can save something by selling into a panic or make money by buying into euphoria.
Here’s a summary of the behavior I’ve noticed among small investors over the years: Wait for the market to prove to us it will go back up and then buy, usually near the top. Or the reverse: Wait for a sell-off and then dump at losses – in other words, panic-sell.
This is called “market timing.” We think we know where the market is going, but that isn’t much different from believing we can pick the best or the worst days.
When it comes down to it, if your decisions are based on the emotions of the moment, positive or negative, they will always result in missing all or most of the market returns. You will end up on or very close to all the green lines.
Every study ever conducted on the subject has concluded that “buy and hold,” shooting for the light blue line, is the only realistic approach to profiting from the market.
This last chart makes a great point about jumping ship when volatility spikes. And, besides inexperience, what drives almost all of this selling and buying is volatility, not changes in fundamentals. It is what drives our fear and pushes most of us in and out of the market.
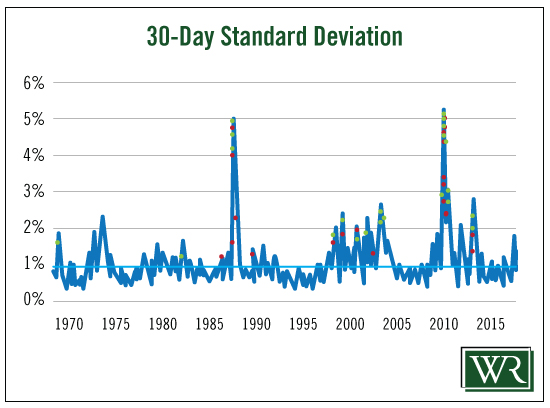
The green dots show the best days and the red dots represent the worst days. As you can see, the dots cluster together during periods with the greatest volatility – for the sake of simplicity, the spikes. That’s when most of us cut and run, or – just as bad – buy at the top.
If we get lucky, which isn’t too often, we do nothing.
The money press may say “buy and hold” is dead, but for my money, it is the only realistic long-term solution. And the numbers prove it.
If you don’t have a 10-year time horizon for your holdings, you are cutting your own throat. The longer you hold, the better your chances of hitting the only reasonable outcome: the light blue line.
The chances of guessing what the best and worst days for an investor will be are close to zero.
But the green line – the worst-possible scenario – is the most common outcome for the small investor.
Continue to cut and run during volatility, or buy when the pundits are calling for ridiculous new highs, and the most common outcome is all you’ll ever see.
Good investing,
Steve
[ad#IPM-article]
Source: Wealthy Retirement
