
Before the New Year, we were looking for gold to make a big move higher… And that’s exactly what happened.
If you bought the precious metal on New Year’s Eve and sold it last Thursday, you made about $48 an ounce. That’s a solid 4.5% gain in just one week.
Now, though, the seasonally strong period for gold has ended. So let’s take a fresh look at the metal and see where it might be headed next…
Here’s an updated chart…
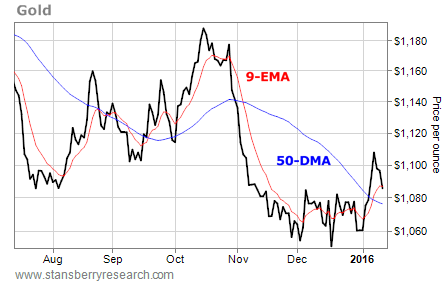 Last week’s action pushed the price of gold above both its nine-day exponential moving average (EMA), the red line on the chart, and its 50-day moving average (DMA), the blue line on the chart.
Both of these lines, which were former resistance levels, should now serve as support.
More important, though, is that the nine-day EMA has crossed above the 50-DMA.
[ad#Google Adsense 336×280-IA]This “bullish cross” often marks the start of an intermediate-term rally phase.
A similar bullish cross in mid-September ignited a month-long rally that saw gold gain almost 6%.
This week, gold has pulled back and is now at $1,085 per ounce… Right on the support of its nine-day EMA.
The 50-DMA is just a few dollars below, and will act as even more support.
If gold has indeed started a new intermediate-term rally, prices shouldn’t pull back much below this area of support.
Another factor that would support even higher gold prices is the potential for a breakdown in the chart of the U.S. dollar. Take a look…
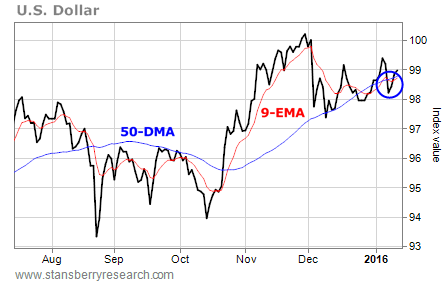 The U.S. dollar is sitting just above the support of its moving averages. And the nine-day EMA is dangerously close to crossing below the 50-DMA and creating a “bearish cross” on the chart.
If the dollar turns lower from here, it would be a bullish sign for gold… And it should be the catalyst that sends gold prices higher over the next few weeks.
Aggressive traders can buy gold right here while it tests support. Set a stop on the trade around $1,060 an ounce to minimize the loss in case we’re wrong.
Best regards and good trading,
Jeff Clark
[ad#stansberry-ps]
Source: Growth Stock Wire
