
The bulls need to make a stand RIGHT NOW.
If they don’t, the bull market is over…

[ad#Google Adsense 336×280-IA]I’ve been cautious on the broad stock market over the past year for a variety of reasons…
First, the market typically forms an important, long-term peak about every seven years. The last peak was in late 2007.
So we’re overdue for one now.
Second, the yield on the 10-year Treasury note spiked sharply higher a few months ago. Large interest-rate spikes often occur a few months before a major stock market top.
Third, margin debt – the amount of borrowed money investors have put into the stock market – reached an all-time high of $507 billion in April. This indicator also tends to peak a few months before a major stock market top.
The only thing keeping me from turning outright bearish on the stock market has been the price action. The uptrend of this bull market has been remarkably strong. Buyers have stepped up during every small pullback over the past few years.
Until the recent decline, the last time the S&P 500 had fallen more than 10% from its highs was way back in November 2011.
But now that’s changing…
At the bottom of the decline last month, the S&P 500 was trading 11% below its all-time high. That’s the biggest correction we’ve seen in the past four years. And unless stocks rally sharply over the next two trading sessions, the selloff could get a whole lot worse.
Take a look at this monthly chart of the S&P 500 plotted with its 20-month exponential moving average (EMA)…
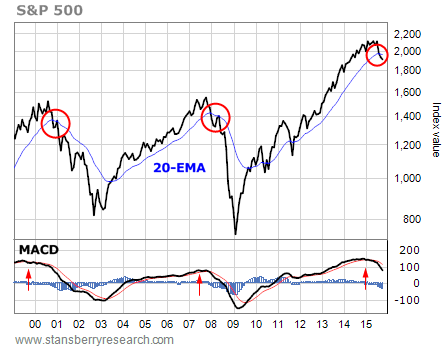
I use the 20-month EMA as the defining line between bull markets and bear markets. If the S&P 500 is trading above the line, stocks are in a bull market. If the index dips below the line, stocks are in a bear market.
The red circles on the chart show the starts of the bear markets in 2000 and 2007. They both started as the S&P 500 closed below its 20-month EMA and a few months after the moving average convergence divergence (MACD) momentum indicator turned lower from an extended position.
The red arrows point to the MACD reversals. This indicator gave investors fair warning back in 2000 and 2007. It’s giving us a good warning this time as well.
The MACD indicator turned lower a few months ago. And the selloff in the stock market over the past week has pushed the S&P 500 below its 20-month EMA.
That means there’s a good chance we’re headed toward a bear market and a sustained period of lower stock prices.
Now, before we get too bearish… let’s remember that this is a monthly chart of the S&P 500. All that matters is how the index closes at the end of the month. September still has [one] trading [day] left. If the S&P 500 can rally and end the month above its 20-month EMA, the bull market will remain intact for at least another month.
Also, as you can see from the red circles on the chart, it is common for the S&P 500 to come back up and “kiss” the 20-month EMA from below. This happens because the decline that pushes the S&P 500 below the 20-month EMA usually creates extreme oversold conditions. So the market bounces back to work off those oversold conditions before making a larger move lower.
It’s that kiss from below that gives traders a chance to unload long positions and then short stocks in anticipation of lower prices.
But we’ll cross that bridge if we come to it.
For now, the market still has [one] more trading [day] to climb back above the 20-month EMA and keep the bull alive a while longer. If it doesn’t, this could be the start of a bear market.
Best regards and good trading,
Jeff Clark
[ad#stansberry-ps]
Source: Growth Stock Wire
