
You can’t blow up a popped balloon.
You can try. You can blow into one end and watch the balloon whip around like a flag in the wind. But it won’t inflate.
[ad#Google Adsense 336×280-IA]That’s China’s stock market right now…
The Shanghai Stock Exchange Composite Index (the “SSEC”) has popped.
After rallying more than 130% in about a year, the SSEC has fallen 30% in just the past month.
The Chinese government is trying to re-inflate the balloon by lending money to investors to buy stocks, making it illegal to sell stocks short, restricting the ability of investors to sell shares, and even buying stocks directly itself.
The SSEC has responded by gaining 500 points over the past few sessions. But the gains are temporary. As soon as the government stops blowing, China’s stock market will drop back down – probably to even lower levels than where it was last week.
Take a look at this updated chart of the SSEC that I showed you last December…
 The nearly vertical move in the index since the start of the year pushed the SSEC close to its resistance line at 5,500 – which goes all the way back to 2008. The sudden drop over the past few weeks has erased all of those gains. And the SSEC tested support at the 3,500 level – which was previously resistance. That was a logical place for the market to find support and attempt a bounce.
But… as the Wall Street saying goes… even a dead cat will bounce if you drop it from a high enough level.
China’s big bounce over the past week isn’t the start of a new rally phase. It’s an oversold bounce that will most likely end soon. China’s stock market has lower to go.
Here’s another way to look at it…
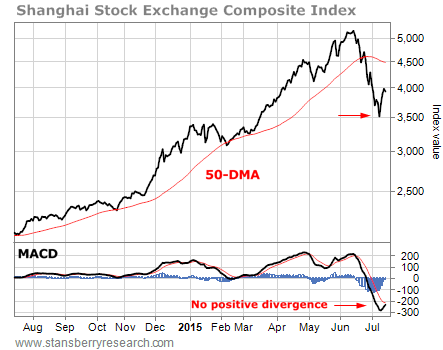
The moving average convergence divergence (MACD) momentum indicator showed no positive divergence as the SSEC hit its low last week. In other words, as the index was falling, the MACD indicator was falling as well. This means the downtrend in Chinese stocks is intact and likely to continue.
What China bulls need to see now is an oversold bounce that rallies the MACD indicator back toward its zero line. Then, if the market declines and makes a lower low while the MACD indicator forms a higher low, we’ll have the “positive divergence” necessary to form a potential reversal pattern on the chart.
We are several weeks, or months, away from that happening.
China’s market is headed lower. Look for the SSEC to challenge one of the lower support levels on the chart – either 3,100 or 2,500 – before finding a bottom.
Best regards and good trading,
Jeff Clark
[ad#stansberry-ps]
Source: Growth Stock Wire
