
We’re likely in the early stages of a correction…
As I showed you last week, the S&P 500 broke below its 50-day moving average (DMA). And the nine-day exponential moving average (EMA) crossed below the 50-DMA. Both of these are bearish events.
[ad#Google Adsense 336×280-IA]In preparation for this correction phase, last month I shared two of my favorite chart patterns for trading stocks that appear ready to fall… the “Bearish Rising Wedge” and the “Head and Shoulders Top” formation.
Now, with the correction likely here, it’s important to get ready for the inevitable “bottoming” process that follows.
So today and tomorrow, I’m covering two bottoming patterns that have proved profitable for me over the years…
The “Bullish Falling Wedge” pattern provides an early warning sign that a downtrend is coming to an end – at least in the short term. And a breakout from the pattern can generate quick, short-term gains.
The pattern forms as a stock makes lower highs and lower lows, but where the distance between those highs and lows gets smaller.
For example, take a look at this chart of the Market Vectors Coal Fund (KOL) from April 2014 to the end of January…
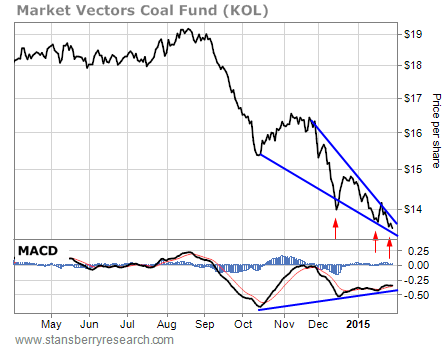
Coal stocks have been in a bear market since the broad commodities complex topped back in 2011. KOL was trading near $48 per share back then. At the end of January, as you can see from the chart, KOL was trading in the $13 price range.
Buying KOL as a long-term holding at any time over the past four years would have been a disaster. But even in downtrends, there are opportunities to trade stocks from the long side. The bullish wedge helps pinpoint those opportunities.
The blue lines on the chart show the bullish wedge formation. You can see how the support and resistance lines came together. So the stock was preparing to break out of this pattern – one way or another – soon.
There was no way to know for sure in advance which way the stock would break out (up or down). But there were clues.
For example, the moving average convergence divergence (MACD) momentum indicator at the bottom of the chart had been rising as KOL had been falling. This “positive divergence” on a key momentum indicator is a warning sign that the trend may be ready to reverse.
Also, the more “touches” a stock has to the support line of the wedge, the more valid the pattern is and the greater the chances for a breakout to the upside. In this example, KOL had tested the support line of the wedge three times (indicated by the red arrows). That was enough to make the pattern valid and justify a potential trade from the long side.
Here’s how the pattern played out…
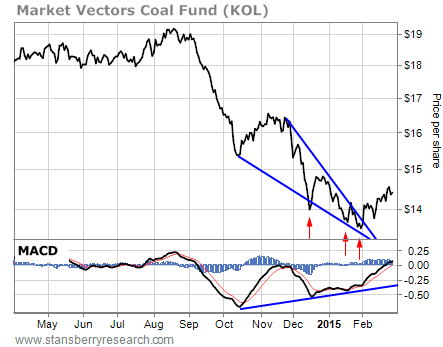
KOL rallied 8% over the following month.
Remember, this pattern is for short-term trades only. Breakouts from a falling wedge usually only last a few days to a few weeks. Often, the stock then falls back toward its previous low and sets up some other form of bottoming pattern.
So the bullish wedge isn’t designed to generate long-term investing ideas. But it does a good job of picking out quick trades that are set to bounce off the bottom.
Tomorrow, we’ll look at another one of my favorite bottoming patterns… the “Inverted Head and Shoulders” formation.
Best regards and good trading,
Jeff Clark
[ad#stansberry-ps]
Source: Growth Stock Wire
