Yesterday, I shared one of my favorite patterns for identifying opportunities to profit when stocks fall… the “Bearish Rising Wedge.”
[ad#Google Adsense 336×280-IA]This pattern provides an early warning sign that an uptrend is coming to an end – at least for the short term.
And a breakout from the pattern can generate quick, short-term gains for folks willing to bet on the downside.
(If you’re not familiar with short selling, you can learn more here.)
Today, we’ll take a look at another one of my favorite chart setups to profit as stocks move to the downside… the “Head and Shoulders Top” formation…
The head and shoulders (H&S) top formation signals the end of a bullish trend and the beginning of a bearish one.
And it can lead to large and fast gains.
To show you how it works, let’s take a look at one of the most epic examples of the H&S pattern… the S&P 500 in 2007…
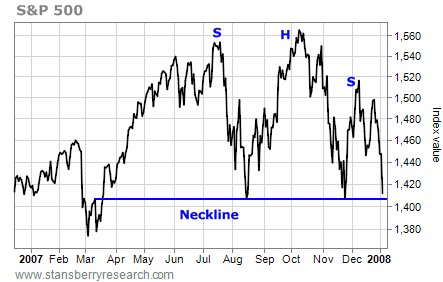
The left shoulder formed when the market peaked in July and then dropped into August. The index rallied again and made a new high in October – which created the “head” of the pattern. The next decline failed to make a higher low. Instead, it bottomed at the spot of the August low, forming the neckline on the chart. The next rally formed a lower high and created the right shoulder of the pattern in December.
You can calculate the next projected price target for an asset or index in this pattern by taking the difference between the top of the head and the neckline (160 points, in this case) and subtracting it from the neckline (which was at 1,400). So, we would have gotten a price target of about 1,240.
Also, since it took about nine months for this pattern to develop, we would estimate it would take about nine months for the S&P 500 to reach 1,240.
Now, look at what happened nine months later…
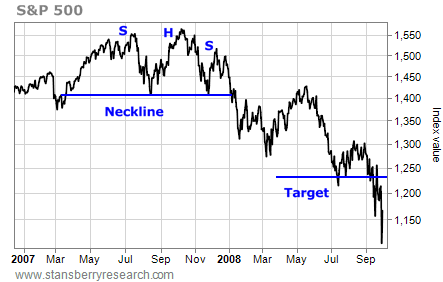
The price target was hit… and then some. Holding a short position on the S&P 500 through this period would have paid off well.
But here’s the important thing to remember with this pattern: Spotting it is easy. The H&S top formation has become well-known. Everyone seems to recognize it. So, like any technical indicator that gathers a large following, this pattern generates a lot of false signals. I’ve seen H&S topping patterns start to break down, only to then reverse course and move higher instead.
So while aggressive traders might try to take a short position just as the right shoulder is forming, rather than waiting for a break of the neckline… it’s better to wait for the pattern to actually break down, and then use any subsequent rally back up to the neckline as an opportunity to get short.
For example, in this situation with the S&P 500, the breakdown occurred in January 2008. But there was a quick, snapback rally in February that pushed the index all the way back up to the 1,400 level. That was an ideal spot at which to put on a short trade.
We’ll likely see a similar sort of setup when the current aging bull market in stocks finally comes to an end. So keep an eye out for this pattern. It could help you make big profits when the bear arrives.
Best regards and good trading,
Jeff Clark
[ad#stansberry-ps]
Source: Growth Stock Wire
