It’s fun to make money as stocks move higher. But my favorite trades have always been the ones where I’ve profited by betting on the downside.
Maybe it’s twisted… but there’s a special thrill that comes with knowing you’re making money when almost everyone else is losing it.

[ad#Google Adsense 336×280-IA]That’s why I’ve always loved bear markets.
And I’m looking forward to the day when this current six-year-old bull market hands the reigns over to the bear.
In bear markets, there is no such thing as a long-term position.
The gains come fast (stocks fall faster than they rise) and traders have to act quickly to lock them in.
Today and tomorrow, I’m going to share two of the chart setups I use to profit as stocks move to the downside. We’ll start things off today with the “Bearish Rising Wedge”…
The bearish rising wedge pattern provides an early warning sign that an uptrend is coming to an end – at least for the short term. And a breakout from the pattern can generate quick, short-term gains for folks willing to bet on the downside.
The pattern forms when a stock is in an uptrend – making higher highs and higher lows. But the distance between the highs and lows gets smaller.
Here’s an example from last year with health insurance company Aetna, Inc. (AET)…
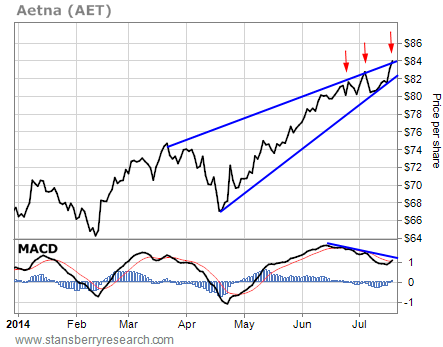
Shares of Aetna had been in a solid uptrend from February 2014 through July 2014. In just five months, AET rallied from around $64 per share to $84. That’s a gain of 31%.
Selling short shares or buying puts on AET during that five-month period would have been a disaster. But even in uptrends, there are opportunities to trade stocks from the short side. The bearish rising wedge pattern helps to pinpoint those opportunities.
The blue lines form the support and resistance lines of the rising wedge. You can see how they’re coming together as the stock approaches the apex of the pattern. So, AET was poised to break the wedge one way or the other… in a short period of time.
There was no way to know in advance which way the stock would break out (up or down). But there were clues…
For example, the Moving Average Convergence Divergence (MACD) momentum indicator at the bottom of the chart showed negative divergence. In other words, as the stock had been rallying, the momentum behind the move had been falling. That’s a good sign that the stock may be ready to break down.
Also, the more “touches” a stock has to the resistance line at the top of the wedge, the more valid the pattern is, and the greater the chances for a breakdown. In this example, AET had tested the resistance line of the wedge three times (as indicated by the red arrows). That’s the minimum number of touches I look for to validate the pattern. This action suggests the most likely move will be to the downside.
Here’s what happened next…
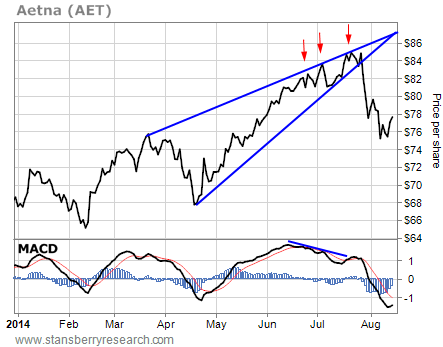
AET broke the rising wedge pattern to the downside. The stock fell $9 – or roughly 11% – in just two weeks.
The rising wedge pattern helps identify short-term trading opportunities to the downside. The closer the stock gets to the apex of the wedge, the sooner the move is likely to occur. And when stocks break down from this pattern, the first push lower is usually enough to generate a good profit on the trade. As I wrote earlier, stocks tend to move down a lot faster than they move up.
Tomorrow, we’ll look at another one of my favorite topping patterns… the “Head and Shoulders Top” formation.
Best regards and good trading,
Jeff Clark
[ad#stansberry-ps]
Source: Growth Stock Wire
