
Natural gas is set to break out.
Last year at this time, the price of natural gas was trading at nearly $5 per thousand cubic feet (Mcf).
[ad#Google Adsense 336×280-IA]Two weeks ago, natural gas bottomed at about $2.50 per Mcf. That’s a drop of 50%.
This drop isn’t too much of a surprise.
After all, natural gas often trades in sympathy with oil. And since oil prices have fallen dramatically over the past year, it’s normal for natural gas to be trading lower as well.
But the price of oil has been rallying lately. A barrel of benchmark West Texas Intermediate (WTI) crude oil traded for just more than $40 one month ago.
It closed at $56 per barrel last Friday. That’s a 40% spike in just one month. Meanwhile, natural gas has barely budged off its bottom. It has been left behind by the recent oil rally.
That’s about to change…
Two weeks ago, my colleague Matt Badiali told you about the fundamental case in support of higher natural gas prices – increasing demand from Mexico.
Not only is the fundamental case strong for higher natural gas prices… the technical case is supported as well.
Take a look at this chart…
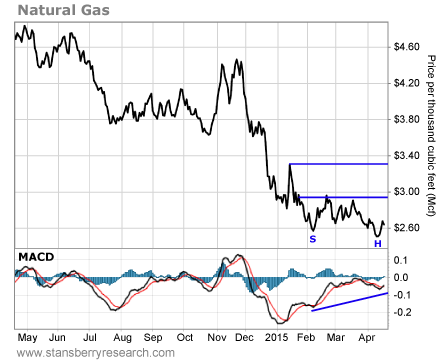
The bottom in the price of natural gas two weeks ago was lower than the previous bottom in February. But while the price was making a lower low, the Moving Average Convergence Divergence (MACD) momentum indicator made a higher low. This “positive divergence” is often an early warning sign that a downtrend is ending and a new uptrend is ready to begin.
Also, while it’s going to take some work to complete it, we have the beginnings of an inverse head-and-shoulders pattern on the chart. This is a reversal pattern that often signals the end of a bearish move and the start of a bullish one.
The left shoulder formed in February when natural gas bottomed at about $2.60 per Mcf. Natural gas then rallied up to resistance at about $2.90 – thereby establishing the neckline of the pattern.
The recent drop to $2.50 per Mcf two weeks ago established the “head” of the inverse head-and-shoulders pattern.
Now, we should get another rally up toward the neckline at $2.90, followed by a drop back down toward the $2.60 level to form the right shoulder.
If this pattern plays out, then any subsequent rally that breaks above the neckline should lead to an immediate move higher toward $3.30 per Mcf. That’s almost a 30% gain from Friday’s closing price.
Traders can set a stop loss at the April low of $2.50 per Mcf. If natural gas prices break below that, it would negate the potentially bullish setup and traders would stop out for a small loss.
In short, right now, natural gas prices are supported by the current rally in oil, there’s increasing demand in Mexico, and the technical picture looks bullish.
This is an excellent setup for a low-risk trade in natural gas.
Best regards and good trading,
Jeff Clark
[ad#stansberry-ps]
Source: Growth Stock Wire
