
In December, I told you stocks were gearing up for a seasonal rally.
After hitting a new high in early December, the S&P 500 started to fall. By mid-month, the index had lost 3.5%. It had broken below the support of its 50-day moving average (DMA). And most financial television talking heads were looking for lower prices.
But we saw things differently… We saw a market that was giving us a chance to buy into extreme oversold conditions just in time for the “Santa Claus” rally (an end-of-year boost in prices) to show up.
[ad#Google Adsense 336×280-IA]And that’s exactly what happened.
The S&P 500 surged 5% in two weeks.
Today, the stock market has an almost identical setup…
The S&P 500 made a new all-time high earlier this month.
Then it started to fall.
At Tuesday’s close, the S&P 500 finished 3.5% below its all-time high.
The index has broken below the support of its 50-DMA. Many technical indicators are extremely oversold. And the financial television talking heads are once again looking for lower prices.
But as I pointed out on Tuesday, we’re heading into one of the strongest seasonally bullish periods for the stock market. Between March 1 and April 30, stocks have rallied nine times out of the past 10 years. The average return for that period is a gain of 5.4%.
So the market is once again giving us a chance to buy into extreme oversold conditions just in time for a seasonal rally.
Take a look at this updated chart of the S&P 500 plotted along with its Bollinger Bands…
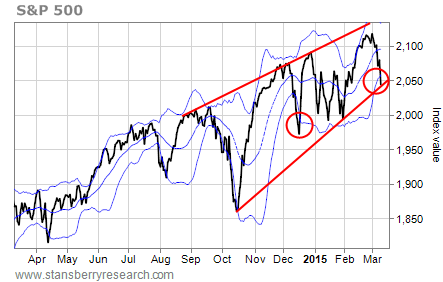 The S&P 500 closed Tuesday right on the support line of the rising-channel pattern. So this is a logical area at which to expect some sort of bounce to develop.
Notice also, though, that the index closed below its lower Bollinger Band.
Bollinger Bands measure the most likely trading range for a stock or an index. Any time an index moves outside of its Bollinger Bands, it indicates an extreme move – one that is likely to reverse.
The last time the S&P closed below its lower Bollinger Band was in mid-December – right before the start of the “Santa Claus” rally.
Now, take a look at this chart of the NYSE McClellan Oscillator (the “NYMO”) – a measure of overbought and oversold conditions…
 A reading of more than 60 on the NYMO points to overbought conditions and often marks the end of a rally in the market. A reading of less than -60 points to oversold conditions and often marks the end of a downtrend in the market.
The NYMO closed at -60 on Tuesday.
That’s not as oversold as conditions were in December. But it’s oversold enough to look for the end of the current decline phase and anticipate a new rally phase.
So, just as I bought stocks in mid-December in anticipation of a seasonal rally through the end of the year, I bought stocks this week in anticipation of a springtime bounce. I urge you to do the same.
Best regards and good trading,
Jeff Clark
[ad#stansberry-ps]
Source: Growth Stock Wire
