
Last month, I urged you to buy gold.
The metal had just flashed a major buy signal. It was the first long-term buy signal since mid-2009. Traders who bought on that signal could have made 70% gains in a little more than two years.
[ad#Google Adsense 336×280-IA]But even though we had a long-term buy signal too powerful to ignore, I said the metal was slightly overbought in the short term.
So it was vulnerable to a pullback.
Gold has done nothing but fall in value since then.
It’s $50 cheaper today than it was last month.
And a lot of traders are probably wondering if the buy signal has failed.
It hasn’t. The buy signal on the monthly chart is still intact. And now, the short-term indicators are turning bullish as well…
Let’s start by looking at the long-term monthly chart of gold with its Moving Average Convergence Divergence (MACD) momentum indicator…
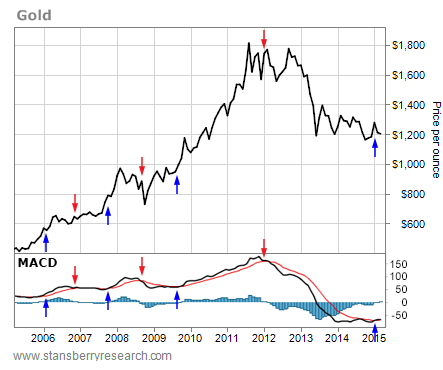
The MACD is often used for determining overbought and oversold conditions. But it can be used as a timing indicator, too.
Without getting too complicated, when the black MACD line crosses above the red MACD line, we have a “buy” signal. When the black line crosses below the red line, we have a “sell” signal.
The red arrows on the chart indicate sell signals. The blue arrows show the buy signals.
As you can see, we got a buy signal at the end of January. And since the black line is still trending above the red line on the MACD momentum indicator, the buy signal is still in play.
Now, take a look at the short-term daily chart of gold…
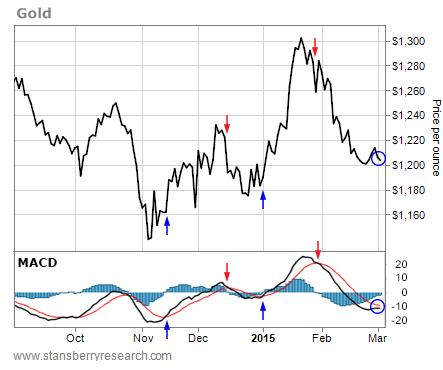
While the long-term monthly chart was flashing a buy signal at the end of January, the short-term chart was rolling over to a sell signal. So, while the more powerful long-term trend was turning bullish, gold was vulnerable to a short-term pullback. As I said, the long-term monthly signal didn’t mean gold had to go higher right away. “It could plunge $40 tomorrow – sending traders rushing for the exits.”
That’s what we’ve seen over the past month. But now, after the big drop in price, the daily MACD indicator is oversold… and the black line is on the verge of crossing over the red line. When that happens, we’ll have a buy signal on both the long-term and short-term charts.
So today, the long-term case for gold is just as strong as it was at the beginning of February. And with gold $50 per ounce lower and on the verge of a short-term buy signal, the short-term risks are lessened. If you haven’t bought gold yet, now is a great time.
And if you bought gold in February, hang on. There are likely big gains ahead.
Best regards and good trading,
Jeff Clark
[ad#stansberry-ps]
Source: Growth Stock Wire
