
Last month, I told you the U.S. dollar was going to break down.
You see, parabolic moves – a move that is nearly straight up in an asset – always end at some point.
[ad#Google Adsense 336×280-IA]The dollar did pull back shortly after my essay.
But it wasn’t the dramatic decline that typically follows a parabolic move.
It was mild and shallow.
Since then, the U.S. Dollar Index has rebounded and rallied to an even higher level.
And traders are betting on the rally continuing.
But in the short term, I’m not so sure…
Take a look at this daily chart of the U.S. Dollar Index…
 Note the Moving Average Convergence Divergence (MACD) momentum indicator at the bottom of the chart. The MACD is a measure of overbought and oversold conditions. And today, the MACD is overbought – which warns of an impending decline in the market.
Also, while the index has been hitting new highs, the MACD has been making new lows. This “negative divergence” is often the first warning sign a rally is nearing an end.
And according to the most recent Commitment of Traders (COT) report, speculators are now more bullish on the dollar than at any other time in history.
The COT report measures the number of participants on each side (long or short) of a trading position. When the COT reaches an extreme level of bullishness or bearishness, it can signal an impending market reversal… so this many speculators bullish on the dollar is a bearish sign.
But in the longer term, the dollar looks bullish. Take a look at this long-term monthly U.S. Dollar Index chart…
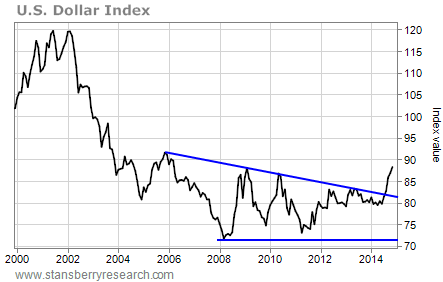 As you can see, the dollar has broken out to the upside of a nine-year-long consolidation pattern. There is some resistance at the 2005 high just above 90. But if the dollar can get above that level, there’s a lot of upside potential. Over time, we could even see the index make it all the way back up to the 120 level where it peaked back in 2002.
Of course, it won’t be a straight move up. And those sorts of powerful rallies don’t happen with so many speculative traders bullish on the dollar.
With short-term conditions extended and overbought, it’s reasonable to expect a decent-sized pullback in the dollar index – back down toward the 82 level, where the dollar’s parabolic move first started. A drop down to the 82 level would be enough of a move to shake the overly bullish speculators out of their long positions. It would also correct the overbought extremes of the recent parabolic rally and retest the former resistance line on the long-term chart as support.
So traders can bet against the buck for the moment. But once we get a pullback toward the 82 level, it will be time to get out of those positions. And this will be the point longer-term investors should be looking to buy the buck.
Best regards and good trading,
Jeff Clark
[ad#stansberry-ps]
Source: Growth Stock Wire
