
 The stock market is ripe for a crash.
The current bull market is one of the longest in history. We haven’t seen a stock market correction of more than 10% in almost three years.
And historically, the stock market makes an important, long-term top every six to seven years. The last top was in September 2007. So the market is primed for another one right now.
Make no mistake, a collapse is coming… The warning signs are starting to flash. And it will end badly.
[ad#Google Adsense 336×280-IA]But we’re not there yet…
Throughout history, there have been three warning signs that precede nearly every market collapse. We saw them before both the 2008 global financial crisis and the 2000 dot-com bubble.
And we’re seeing two of these warning signs today…
The first is a sharp and sudden rise in interest rates.
Prior to the stock market making an important long-term top, the 10-year Treasury note yield has ALWAYS spiked higher.
For example, the 10-year yield was just 4.5% in January 1999. One year later, it was 6.75% – a spike of 50%. The dot-com bubble popped two months later.
In 2007, rates bottomed in March at 4.5%. By July, they had risen to 5.5% – a 22% increase. The stock market peaked in September.
Here’s how the 10-year Treasury note yield looks today…
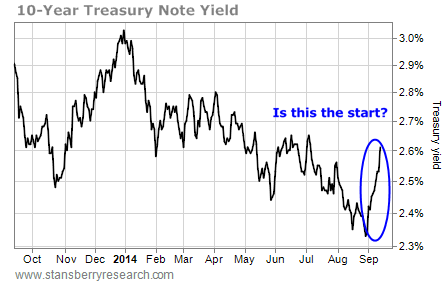 The 10-year yield bottomed at 2.35% three weeks ago. It’s now at 2.6%. That’s a 10% increase in just three weeks. So this could be the start of a sharp move higher in rates.
Along with a spike in interest rates, we’re also seeing a record amount of stock purchased on margin.
The stock market tends to form important tops around the same time as margin debt peaks. In other words, just as investors have borrowed the most money to buy stocks in the stock market, the market starts to fall.
Here’s a look at the history of peak margin debt and how it lined up with a top in the stock market…

This year, margin debt hit an all-time high of $464 billion in June… And the stock market rallied to a new all-time high this month.
So we now have two warning signs of a top in the market. But it’s not time to panic yet. You see, until the third warning sign flashes, it’s too early to worry about a collapse.
And our third warning sign won’t flash until the market’s price action turns lower.
Take a look at this chart of the S&P 500…
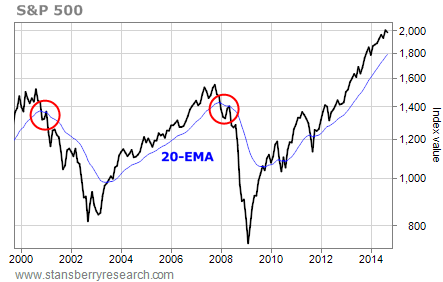
that separates bull markets and bear markets. When the S&P 500 is trading above its 20-month EMA, stocks are in a bull market. When the index drops below the line, stocks are in a bear market.
As you can see, the S&P 500 is well above its 20-month EMA today. Stocks are still in a bull market.
So even though we have rising interest rates and record levels of margin debt, we don’t yet have price action that confirms the top is in place. We’re close… and we’re getting closer every day.
It’s time to be cautious about buying stocks, but it’s not time to sell stocks and start short selling just yet. Until the S&P 500 moves below its 20-month EMA, the bull market will keep going.
Best regards and good trading,
Jeff Clark
[ad#stansberry-ps]
Source: Growth Stock Wire
