
 Last month, I told you gold was setting up for its next big move higher.
The metal had developed a long-term inverse “head and shoulders” pattern on the chart. This is a bullish pattern that often signals the reversal from a bear market to a bull market.
I said if gold managed to rally above the “neckline” of the pattern at about $1,380, the projected target would be up around $1,600 per ounce.
[ad#Google Adsense 336×280-IA]Since my essay, the metal has gone nowhere.
But the gold price may be about to get the push higher it needs from the U.S. dollar…
In May, we looked at the U.S. Dollar Index.
The dollar was setting new lows for the year and looked to be on the verge of an ugly breakdown.
I said a breakdown in the dollar could send the price of gold soaring.
You see, many assets – like gold – typically trade opposite of the dollar. So gold falls when the dollar rallies… And gold rallies when the dollar falls.
But the breakdown didn’t happen. The dollar has rallied nearly 3% over the past three months. And the U.S. Dollar Index is now trading at its highest level this year.
However, the rally is now a bit too extended… and the dollar may be ready to roll over.
Take a look at this chart of the U.S. Dollar Index…
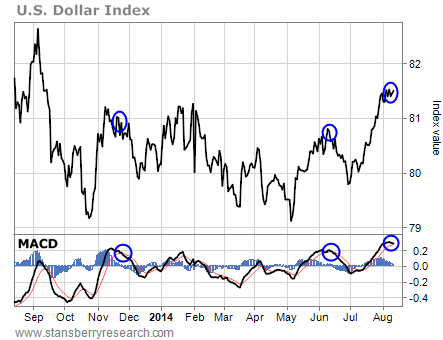 Note the Moving Average Convergence Divergence (MACD) momentum indicator at the bottom of the chart. The MACD is a measure of overbought and oversold conditions.
As you can see, the MACD is now more overbought than at any other time over the past year. It’s also beginning to curl lower. The last few times this happened (the blue circles on the chart), we saw short-term peaks in the U.S. Dollar Index. If that pattern holds true this time around, the dollar will enter at least a short-term-decline phase. But we could see something even worse…
Take a look at this long-term weekly chart of the U.S. Dollar Index…
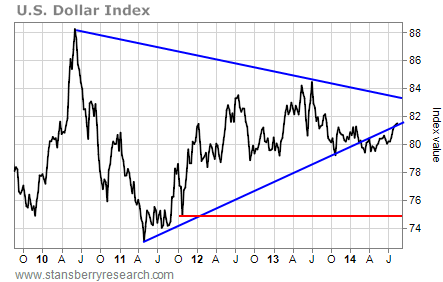 The dollar broke down from a long-term consolidating-triangle pattern earlier this year. As you can see, the recent rally brought the dollar back up to retest the former blue support line of the pattern – which is now resistance. If resistance holds and the dollar turns lower from here, the buck could fall all the way to the red support line at about 75.
A falling dollar – even in the short term – could send the price of gold soaring… which is exactly what the metal needs to kick off its next rally phase.
Best regards and good trading,
Jeff Clark
[ad#stansberry-ps]
Source: Growth Stock Wire
