In May, I told you the next gold rally had just kicked off.
However, since my essay, gold has gone nowhere. The metal is only up around 2%. For comparison, the S&P 500 is up around 5% in the same timeframe.
But that’s about to change. Gold is setting up for a big move higher…
Take a look at this chart of gold…
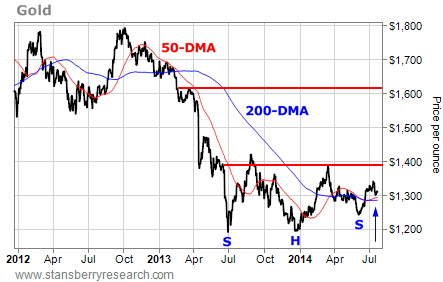
Gold is trading above both its 50- and 200-day moving averages (DMAs). These lines should provide support and limit any downside action in the metal in the short-term.
[ad#Google Adsense 336×280-IA]The metal’s next significant resistance level is up around $1,380.
That’s about a 5% gain from today’s gold price.
But gold is setting up for a much larger move…
The chart has developed a long-term inverse “head and shoulders” pattern.
The left shoulder forms when an asset hits a low point and then rallies.
The head is made when the asset drops to a lower low and then rallies back to its previous high.
The right shoulder forms when the asset drops back down and makes a higher low.
This is how bear markets change into bull markets.
If gold can rally above the “neckline” of the pattern at about $1,380, the projected target is up around $1,600 per ounce.
In the next week or two, gold may pull back and test its 50- and 200-DMAs. But the long-term picture for gold is still bullish. Traders should use these pullbacks as opportunities to buy. It looks like the metal is headed much higher.
Best regards and good trading,
Jeff Clark
[ad#stansberry-ps]
Source: Growth Stock Wire
