 The stock market is showing multiple signs of a short-term top.
That doesn’t mean stocks have to go down right away. Topping is a process – not a one-day event.
We saw great examples of this in 2010 and 2011. In both years, the market rallied through January and hit “overbought” levels on a number of technical indicators that I follow.
Every time the market looked like it was ready to drop, buyers stepped in and pumped stock prices higher. I’m seeing the same thing today…
[ad#Google Adsense 336×280-IA]Back in 2010 and 2011, we didn’t get huge rallies – just a chronic “bid” that pushed stocks up a little bit every day.
The natural ebb and flow of the market disappeared.
Rather than stocks correcting modestly and working off the overbought conditions, stocks had a one-way ticket higher.
Corrections help to relieve overbought conditions and establish “support levels” for stock prices. When the market goes too far without a pullback, it doesn’t establish a higher support level. So when stocks finally start to decline – and they always do at some point – the selloffs can wipe out nearly all the previous rally’s gains.
The “flash crash” in 2010 wiped out several months of gains in one day. And all of last January and February’s gains disappeared two weeks into March.
Right now, there is no ebb and flow to the market. It’s only a one-way move higher. There’s no telling for sure when it will end. Just know that it will end. And when it does, stocks could drop fast.
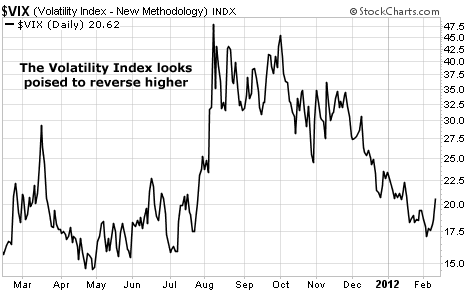
Let me show you what I’m talking about… Here’s a chart of the Volatility Index…

The “VIX,” as it’s called, is the most popular gauge of market volatility and investor fear… Calm periods, when the VIX is low and the stock market is moving steadily higher, are always interrupted by periods of wrenching volatility and falling stock prices… That’s just the way the world works.
Last year, the S&P 500 lost 17% in three weeks as the VIX jumped from under 17 to over 47. We could easily see the same thing happen here in 2012.
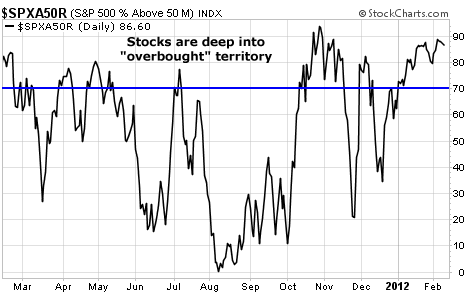
Here’s another indicator flashing a warning sign…

This chart shows the percentage of S&P 500 stocks trading above their 50-day moving averages (DMAs). It’s a momentum indicator that helps determine overbought and oversold conditions.
Typically, stocks are overbought when this chart rallies above 70. They’re oversold when it drops below 30. As of late this week, more than 86% of the S&P 500 stocks were trading above their 50-DMA. That’s about as high as it gets before some sort of selling pressure hits the market.
Add to this the investor sentiment survey (a contrary indicator) showing individual investors are as bullish as they have been in years… and the Commitment of Traders report showing commercial traders (aka the “smart money”) are net short the largest number of S&P 500 futures contracts in five years… and you have a market that is poised for at least a short-term correction.
If stocks follow the same script as they did in 2010 and 2011, we should be on alert for a correction that brings the S&P 500 back down to about where it started the year. That would be a decline of about 6%.
For long-term investors, there’s no reason to panic and abandon the market. But sophisticated traders should be on the lookout for opportunities to go short.
And once the correction comes and relieves the overbought condition of the market, it’ll help set the stage for a late-spring rally. And I’ll be looking for new bullish bets.
Good trading,
Jeff Clark
[ad#jack p.s.]
Source: Daily Wealth

