
The biopharmaceutical company that focuses on patients with genomically defined diseases driven by abnormal kinase activation, Blueprint Medicines Corp (NASDAQ: BPMC) seems to be getting ready for a price bump as per the latest charts.
Bullish Move – Chart Indications
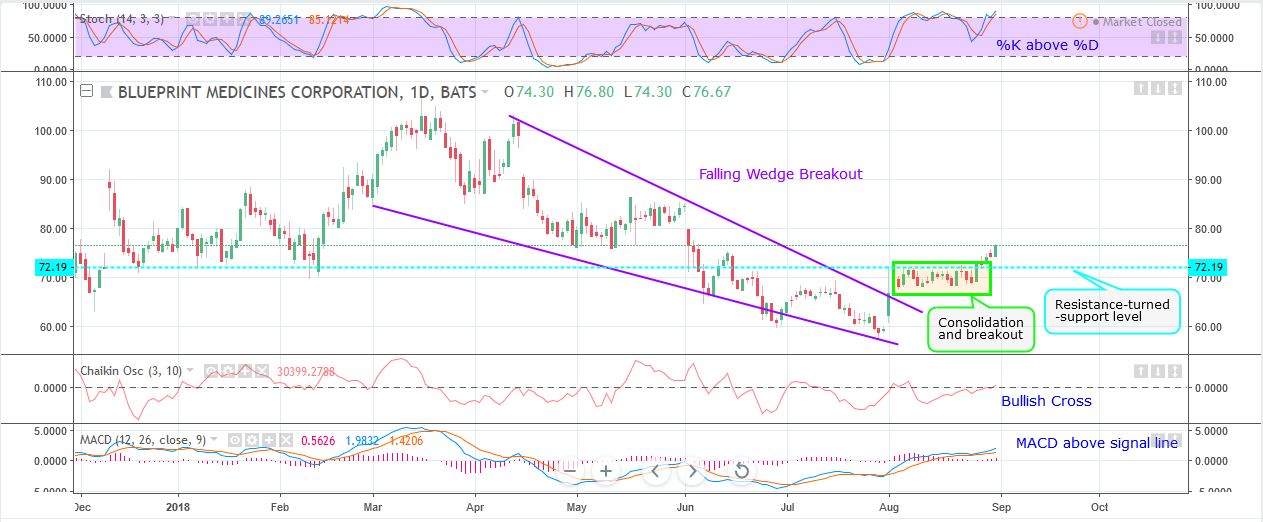
#1 Falling Wedge Breakout: As you can see from the daily chart of BPMC, the stock had formed a falling wedge pattern during the past few weeks. This is marked in the chart in purple color lines. The stock has currently broken out of the falling wedge pattern. A falling wedge is a bullish pattern and a breakout from it implies that the stock may move higher in the short term.
Daily Chart – BPMC
#2 MACD above Signal Line: In the daily chart, the MACD line (light blue color) is currently above the MACD signal line (orange color) which is typically considered as a potential buy signal.
#3 Bullish Cross in Chaikin Osc: Whenever there is a crossover on the Chaikin Oscillator from below the zero line to above the zero line, it is termed as a bullish cross.
Typically, prices start to increase whenever this crossover happens.
Currently, the Chaikin Oscillator has had a bullish cross which is a possible bullish sign.
#4 %K above %D: The %K line of the stochastic is currently above the %D line, indicating bullishness.
#5 Consolidation and Breakout: The stock had consolidated for a while after breaking out from the falling wedge pattern. This consolidation area is marked as a green rectangle. Currently, the stock has broken out of this consolidation area. This seems like a bullish sign.
#6 Good support: There is a good support level close by for the stock which is a resistance-turned-support level. This is marked as light blue color dotted lines. This seems like a good level for the stock price to bounce back in the case of a correction.
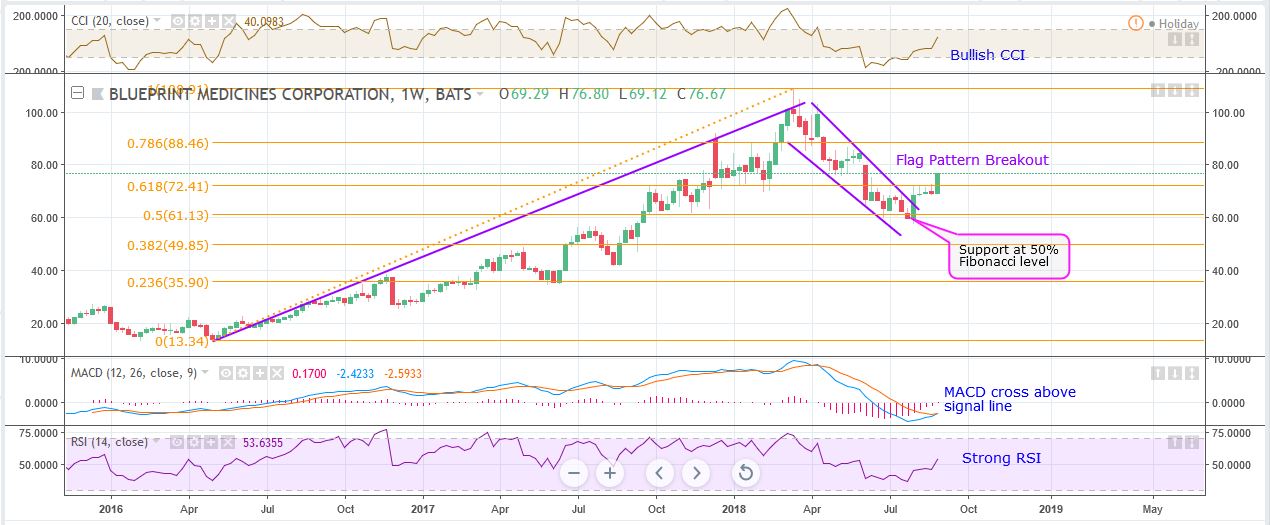
#7 Fibonacci Level Support: Usually, after an up-move, stocks retraces to any of the key Fibonacci levels before surging back again. BPMC had taken support at the 50% Fibonacci support level of the upmove before moving up again, as seen in the weekly chart. This seems like a good support area.
Weekly Chart – BPMC
#8 Strong RSI: The RSI in the weekly chart is currently above 50 and moving up, indicating possible bullishness in the near-term.
#9 Flag Pattern Breakout: As seen from the weekly chart, the stock was in a strong uptrend after which it started consolidating and was in a narrowing range. This is a classic flag pattern and is marked in the chart in purple color. A flag is a continuation pattern. Whenever a stock breaks out of this pattern, it typically continues its previous trend (uptrend in this case). Currently, the stock has broken out of the flag pattern. This is a possible sign of an upcoming bullish move.
#10 Bullish CCI: The CCI is moving above zero from oversold levels. This is a bullish sign.
Recommended Trade (based on the charts)
Buy Levels: If you want to get in on this trade, the ideal entry level for the stock is a close above the major resistance level and above the 200-day SMA. This translates to a close above $80.
TP: Our target prices are $90 and $105 in the next 4-6 months.
SL: To limit risk, place a stop loss below $74.50. Note that the stop loss is on a closing basis.
Our target potential upside is 13% to 31% in the next 4-6 months. For a risk of $5.50, our first target reward is $10 and the second target reward is $25. This is a nearly 1:2 and 1:5 risk-reward trade.
In other words, this trade offers 2x to 5x more potential upside than downside.
Risks to Consider
The stock may reverse its overall trend if it breaks down from the falling wedge pattern with high volume. The sell-off of the stock could also be triggered in case of any negative news, overall weakness in the market, or any regulatory changes in the sector.
Happy Trading!
Tara
Karim Rahemtulla, the trader behind a 400% gain in 24-months on Rolls-Royce, has uncovered another potential multi-bagger. This under-$20 stock gives you exposure to over 1-oz of gold with the lowest production costs in the industry. And an upcoming announcement could send this stock soaring. Get Karim's urgent briefing - click here now.
