I have some bad news for you…
Stocks could struggle – for as long as two years – after the presidential election next week.
[ad#Google Adsense 336×280-IA]It won’t be because of Hillary or Donald’s bad political ideas.
It all comes down to the lessons of history we’ve learned from elections.
You see, politics have a surprisingly large effect on financial markets…
I never would have believed just how powerful an influence politics has on the markets if I hadn’t crunched the numbers myself.
And the conclusions are even more surprising…
For example, stocks tend to perform better when Democrats are in office. Since 1928, the S&P 500 has risen roughly 8% a year (not including dividends) when Democrats have held the Oval Office. Stocks have increased just 2% a year when Republicans have held office.
That’s a great example of what I’m talking about – the result is far outside of any statistical norms. It’s an extreme result, any way you look at it.
But something else has an even bigger influence on stock returns than which party is in office…
It turns out that the most important factor around presidents and stock prices isn’t which party is in office, but what point we are at in a given president’s term.
We call this powerful idea the “election-cycle indicator.” The conclusion from this indicator is: Stocks tend to perform best at the end of a president’s four-year term… regardless of which party is in power.
The table below shows how extreme this phenomenon has been, going back to 1950.
Take a look…
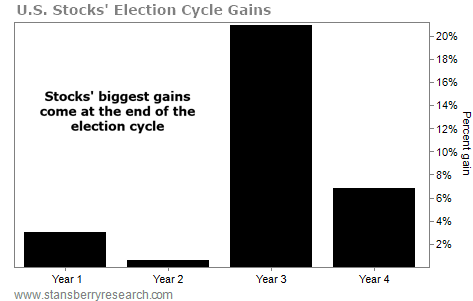
As you can see, the biggest gains in stocks happen during the third and fourth years…
And we’ve seen typical gains of more than 20% during the third year. That’s an incredible result.
(We use quarterly data in this analysis, using September 30 as “year end.” Based on that, we just finished the fourth year of President Obama’s second term.)
Interestingly, these results hold up during both Democrat and Republican presidencies. It doesn’t matter who’s in office… The election-cycle year tends to determine how well stocks perform.
Today, we’re a few weeks into Year 1 for the next president. And based on this indicator, we could be in for a rough two years, regardless of who wins next month’s election.
The caveat here is that these data have plenty of variability. Stocks have soared as much as 43% during Year 1… But they’ve also fallen as much as 28%.
The message from this indicator is powerful. However, I am not throwing in the towel on stocks yet based on this one indicator…
I believe we still have plenty of upside in stocks. In September, I wrote a DailyWealth called “Stop Your Worrying, This Isn’t What a Top Feels Like.”
As I said back then…
Is everyone optimistic about stock prices? Is everyone “in”? Is everyone talking about their “can’t lose” stock strategies at cocktail parties?
If you can’t answer yes, then this is not a top. This is not a moment like the one we had with tech stocks in 1999, or real estate in 2006-2008.
I stand by those words. It might be foolish to bet against the incredible track record of the election-cycle indicator… But that’s what I’m doing this time around.
Good investing,
Steve
[ad#stansberry-ps]
Source: Daily Wealth

