Volatility often soars at turning points…
It doesn’t matter if you’re looking at stocks, bonds, or even real estate. The right price is hard to find when you’re near a major turning point – or a market bottom.
No one knew the right price to pay for stocks in early 2009. No one knew the right price for real estate in 2011. And that led to massive price swings and high volatility.
[ad#Google Adsense 336×280-IA]The same thing is happening in the oil market today.
In the past month, we’ve seen daily gains up to 11%.
We’ve also seen daily losses of as much as 7%.
This doesn’t mean oil is at a bottom today.
But it means we’re likely nearing a turning point for oil prices.
Based on volatility alone, that could mean higher oil prices – potentially much higher prices – are possible over the next year. (This is not taking into account any other factors in the oil market.)
Let me explain…
When the VIX is high, it’s time to buy. And when the VIX is low, it’s time to go.
You’ve probably heard the saying before. The “VIX” refers to the Volatility Index. People call it the market’s “fear gauge.” Stocks tend to bottom when volatility is high… and peak when volatility is low.
What you might not know is that there are volatility indexes for assets other than stocks. And the wisdom above applies to oil’s volatility index as well.
Importantly, the Crude Oil Volatility Index is hitting multiyear highs right now.
Take a look…
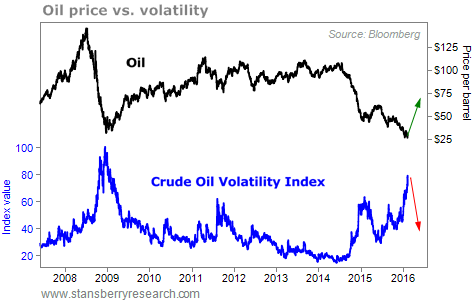 The last time the Crude Oil Volatility Index spiked to a similar extreme was in 2008. And the price of oil more than doubled after volatility came off that extreme in 2009.
Like I said, volatility tends to soar at turning points. Volatility in the oil market has soared recently. And it’s not just the Crude Oil Volatility Index…
Specifically, day-to-day price changes in oil have been dramatic in recent weeks. We recently saw 10 straight days of daily 2%-plus gains or losses. Getting 10 straight days like this is incredibly rare. It has only happened 20 times since 1983.
It turns out, getting even six consecutive 2%-plus-or-minus days doesn’t happen often… it has only occurred 82 times since 1983. But this kind of volatility tends to happen near turning points in oil.
The table below shows the exact details of what happens when we have six consecutive days of the oil price moving up or down by 2%, going back to 1983. Take a look…
 This doesn’t mean the bottom in oil is happening today. The one-month returns are still poor. (I’m actually short an oil investment in my True Wealth Systems newsletter today, although it’s a short-term trade.)
However, this extreme volatility does often mark general turning points for oil prices.
Typical gains have been 19% after six months and 33% after a year. Those are serious returns… and much greater than the typical gains in oil.
Again, we can’t know the exact bottom. But we do know two things… 1) volatility soars near turning points, and 2) oil volatility is soaring today.
These two things by themselves point to the potential for higher oil prices a year from now…
Good investing,
Steve
[ad#stansberry-ps]
Source: Daily Wealth
