 I’m bullish on stocks right now – far more bullish than I’ve been at any time since late-2008/early-2009.
That might surprise readers who’ve seen my stern warnings about the huge risks being taken by central banks.
I still believe these risks are imminent. They aren’t going to go away.
But I also believe you must “make hay when the sun shines.”
[ad#Google Adsense 336×280-IA]Monetary debasement comes with a flipside: rising asset prices – things like stocks and real estate.
That’s why I believe 2012 might be the best year for stocks that we’ve seen in more than a decade.
Two of the most important indicators I follow are signaling the same thing…
These two indicators show me, in real time, using real market-derived values, whether or not money is likely to flow into (or out of) stocks.
We’ll start with the most important…
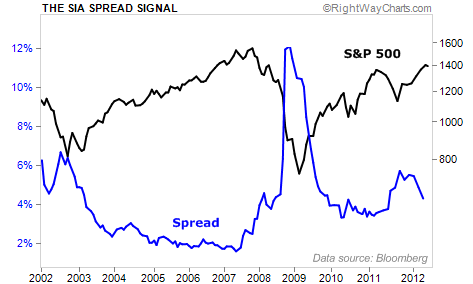
The first chart below shows the “Spread Signal” – risk spread in fixed income.

I want to make sure you understand this chart… so forgive me if you’re already well aware of what it means. The black line is the S&P 500 – stocks. The blue line is the spread (the difference) between high-yield bonds and U.S. Treasury bonds of a similar duration
The price of credit is based on the 10-year Treasury yield. So this chart shows how expensive capital is for most of the small- and medium-sized businesses in America.
When credit is cheap, stocks soar. And when credit is expensive, they plummet. As you can see in the chart, the price of credit right now is “rolling over” – meaning it has stopped increasing and seems poised to contract. That’s what will propel the bull market forward this year in stocks.
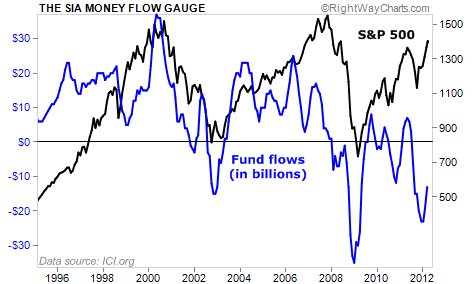
It’s also important to note that most individual investors have not bought back into stocks yet. My second leading indicator – the Money Flow Gauge – tells us so…

This chart compares stock prices to equity mutual fund inflows and withdrawals. Again, the black line is the S&P 500. The blue line is the amount of money (in billions) that people are putting into equity mutual funds or taking out.
As you can see… during 2011, folks were withdrawing money from equity mutual funds in amounts that nearly matched the horrific bear market/panic of 2008.
Now, the tide in mutual funds has only begun to turn. And as mutual funds receive billions of dollars in inflows during 2012, their buying will power this market higher.
In the October 2011 issue of my Investment Advisory, I warned that these indicators were “rolling” over and were predicting an imminent rally in stocks…
Our market indicators show us a significant rally in stocks is likely. In particular, our Money Flow Gauge reveals mutual-fund outflows have grown big enough to be significant. The volume of selling is roughly equal to what we saw near the bottom in 2002…
And the spread between high-yield bonds and Treasurys is surging. That tells me unless the situation in Europe boils over immediately, we will almost surely see a 20%-30% rally in stocks to end the year.
As you know, Europe did not collapse. Stocks bottomed in early October at around 1,100 on the S&P 500. They’re up nearly 27% since then.
With my two most important indicators almost as bullish as I’ve ever seen in my career, I believe stocks have farther to climb.
Good investing,
Porter
[ad#jack p.s.]
Source: Daily Wealth


