
🚀 Watchlist Update
Several stocks from this week’s Top 10 Watchlist have crossed above our recommended buy levels. The charts look particularly favorable for Tesla (NASDAQ: TSLA), Bob’s Discount Furniture (NYSE: BOBS), Celcuity (NASDAQ: CELC), and Atlassian (NASDAQ: TEAM). Trade accordingly!
AppLovin Corporation (NASDAQ: APP) just broke out and looks headed even higher.
As we’ll get to just ahead, the combination of a record-breaking Q1 earnings beat, the imminent global launch of its Axon AI advertising platform, and a fresh technical breakout makes APP one of the more interesting setups on the board. Here’s what’s going on…
The Themes Behind the Move
AppLovin is an end-to-end AI-powered advertising technology company serving businesses in the United States and internationally. It operates through two segments — Advertising and Apps — with the Advertising segment doing the heavy lifting on growth.
In plain English, AppLovin’s core business is helping mobile app developers and, increasingly, e-commerce brands find and acquire customers at scale using AI-driven ad targeting. Its flagship AI engine, Axon, continuously optimizes which ads get shown to which users in real time — which means the better the AI gets, the more value AppLovin delivers to advertisers, and the more they spend on the platform. The company’s business hinges on Axon’s continued improvement, the pace of expansion into new verticals beyond gaming, and how it stacks up against heavyweights like Meta and Google in the performance marketing arena.
APP’s latest move reflects a powerful confluence of developments — operational, technological, and financial — that have come together to fundamentally strengthen the long-term growth story.
| Theme / Catalyst | What Happened | Why Traders Care |
|---|---|---|
| Q1 2026 Earnings Beat & Strong Q2 Guidance | AppLovin reported Q1 revenue of $1.84B (+59% YoY, beating consensus of ~$1.77B) and adjusted EBITDA of $1.56B — an 85% margin, up ~400bps YoY. GAAP EPS came in at $3.56 (a beat). The company guided Q2 revenue to $1.92B–$1.95B (~52–55% YoY growth) with ~84–85% EBITDA margins. Management highlighted $1.3B in free cash flow and continued AI-driven optimization strength. | A revenue beat this large — against consensus on a company growing at 59% YoY — signals that Axon’s AI engine is still accelerating, not plateauing. The combination of record margins and a strong forward guide removes the “peak growth” worry that had been hanging over the stock. |
| Axon Self-Serve Global Launch | AppLovin is set to open its Axon AI advertising platform to marketers globally in June 2026 — moving from a referral-only model to full self-serve access. The company’s CEO highlighted this as a “major milestone.” Axon 2.0 enhancements include improved bid density, advertiser matching, and AI-generated creatives, expected to fuel faster growth in e-commerce and consumer verticals beyond gaming. | The June launch is a structural unlock. Removing the referral bottleneck dramatically expands the addressable advertiser pool — and e-commerce is a much larger TAM than mobile gaming. If Axon can replicate its gaming-vertical performance in consumer and retail, the revenue ceiling moves significantly higher. |
| Sector Tailwinds | In 2026, global mobile ad spend is tracking 8–10% growth, with the focus shifting sharply toward “efficiency” and high-ROI formats. AppLovin’s AI-powered Axon engine is well-positioned as advertisers migrate away from broad targeting toward high-conversion, data-driven platforms. The broader AI-in-advertising wave is still in early innings. | Macro ad spend tailwinds lift the whole sector, but performance-marketing platforms with demonstrable ROAS advantages tend to take disproportionate share in a recovery. AppLovin’s Axon positions it squarely in that category — it’s a direct beneficiary of the flight toward measurable, high-efficiency advertising. |
| Fundamentals & Capital Allocation | Q1 net income surged +109% YoY to $1.21B. The company generated $1.3B in free cash flow and repurchased 2.2M shares ($1B buyback) in the quarter. On May 7, AppLovin filed a universal shelf registration, giving it flexibility for future acquisitions or strategic capital moves. Strong cash generation supports ongoing buybacks and signals management confidence in the trajectory. | A $1B buyback in a single quarter — alongside a 109% YoY net income jump — is a rare combination. It signals that AppLovin is not just growing, but generating genuine cash surplus. The shelf filing adds optionality for M&A without being a dilution red flag, especially given the buyback context. |
| Analyst Coverage | Among the 23 analysts covering APP, the average 12-month price target sits at $664.35, with a high of $860.00 and a low of $340.00 — implying roughly 33% upside to the mean and as much as 72% upside on the high end from recent levels. Recent notes include UBS maintaining Buy (target $716, May 5) and Piper Sandler raising its target following the Q1 earnings beat. | A 23-analyst consensus with a 33% average upside — and meaningful upgrades coming in post-earnings — reflects broad institutional conviction that APP still has room to run. When analysts are raising targets after a stock has already moved, it often signals that estimates are still catching up to the reality on the ground. |
| Market Conviction Signal | On May 7, AppLovin filed a universal shelf registration — a move that can sometimes spook investors who fear dilution. Instead, the stock surged +6.4% on the day to close at $498.87, with the session high reaching $512.69. The market absorbed a potential dilution overhang and bid the stock higher anyway. | When a stock holds firm — or rallies — in the face of a typically bearish catalyst (a shelf filing), it’s a tape signal that institutional buyers are willing to absorb supply. The market voted with real money that the shelf is a tool for growth, not a warning sign. That kind of price action around a potential negative is a meaningful read on underlying demand. |
| Upcoming Triggers | Traders are watching the Axon self-serve global launch in June 2026 (the key scaling catalyst for e-commerce advertiser onboarding), the Annual Shareholder Meeting on June 3, 2026 (virtual), Q2 2026 earnings in early August (expected ~90 days post-Q1), and the H2 2026 rollout of the AI Video Ad Generator to all customers. | The catalyst pipeline here is unusually dense for a near-term window. The June Axon launch is the big one — it’s a binary moment where early advertiser adoption data could re-rate the stock on its own. Stacking that against a likely strong Q2 print in August gives traders multiple shots at upside news flow between now and year-end. |
If needed, swipe or scroll sideways to view the full table.
Put it all together, and APP is looking less like a mobile gaming ad tech play running out of road and more like a full-stack AI advertising platform with an accelerating e-commerce growth engine, 85% EBITDA margins, and a $1B+ quarterly free cash flow machine. The fundamentals are doing a lot of the heavy lifting here.
The story is getting stronger, but the chart is what could determine whether this move has more room to run in the near term. Here are the bullish technical signals traders should be watching now.
Bullish Technical Signals
#1 Symmetrical Triangle Pattern Breakout: The daily chart shows APP breaking out of a symmetrical triangle, marked by converging trendlines of lower highs and higher lows. This pattern reflects a classic compression of volatility — a market in equilibrium, coiling before its next decisive move. The breakout resolves that indecision, and given that the prior trend was bullish, the pattern favors continuation. The breakout carries added conviction when paired with expanding volume, confirming that buyers are driving the move.
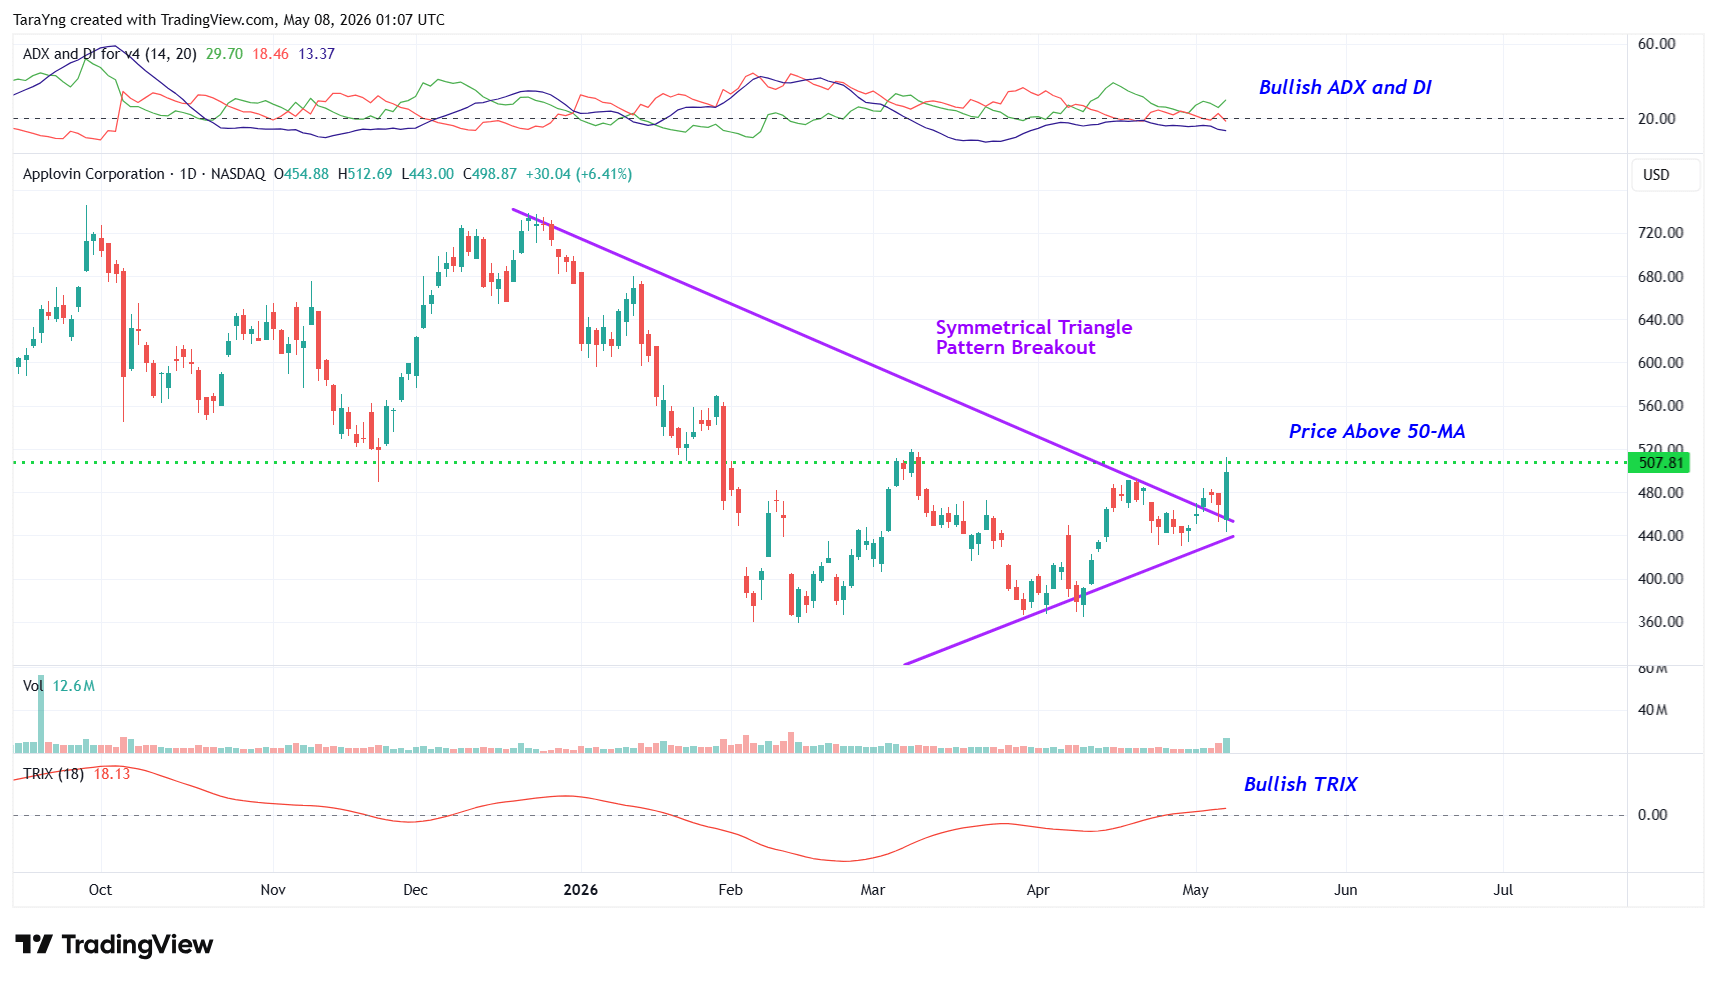
APP – Daily Chart
#2 Price Above 50-Day MA: APP is trading above its 50-day SMA — a line that separates short-term bullish from bearish regimes. The 50-day SMA also acts as a dynamic support level, meaning pullbacks to this zone tend to attract buyers rather than accelerate selling. Price holding above it signals that bulls are in control of the near-term tape.
#3 Bullish TRIX: The TRIX indicator — a triple-smoothed exponential moving average — has crossed above the zero line on the daily chart. Because TRIX applies three layers of smoothing, it filters out the noise that plagues single or double EMAs, making its signals more deliberate and less prone to false positives. A zero-line crossover here suggests that upward momentum is not only present but accelerating — a meaningful early signal for a sustained move higher.
#4 Bullish ADX: The ADX indicator shows that the +DI line is currently above the –DI line, confirming that upward price pressure currently dominates downward pressure. The ADX line is also starting to rise from below the +DI and –DI lines. All together, these indicate a potential strengthening bullish trend rather than a short-term bounce.
#5 Flag Pattern Breakout: On the weekly chart, APP staged a powerful rally before entering a controlled consolidation — the hallmark of a bull flag. The flag’s tight, orderly pullback (marked in pink) reflects profit-taking rather than trend reversal, keeping the underlying demand structure intact. The breakout from this flag is a continuation signal, implying the prior uptrend is resuming. Reinforcing this, APP is trading above its 200-week SMA — a long-term bull/bear dividing line — confirming that the macro trend remains firmly in the bulls’ favor.
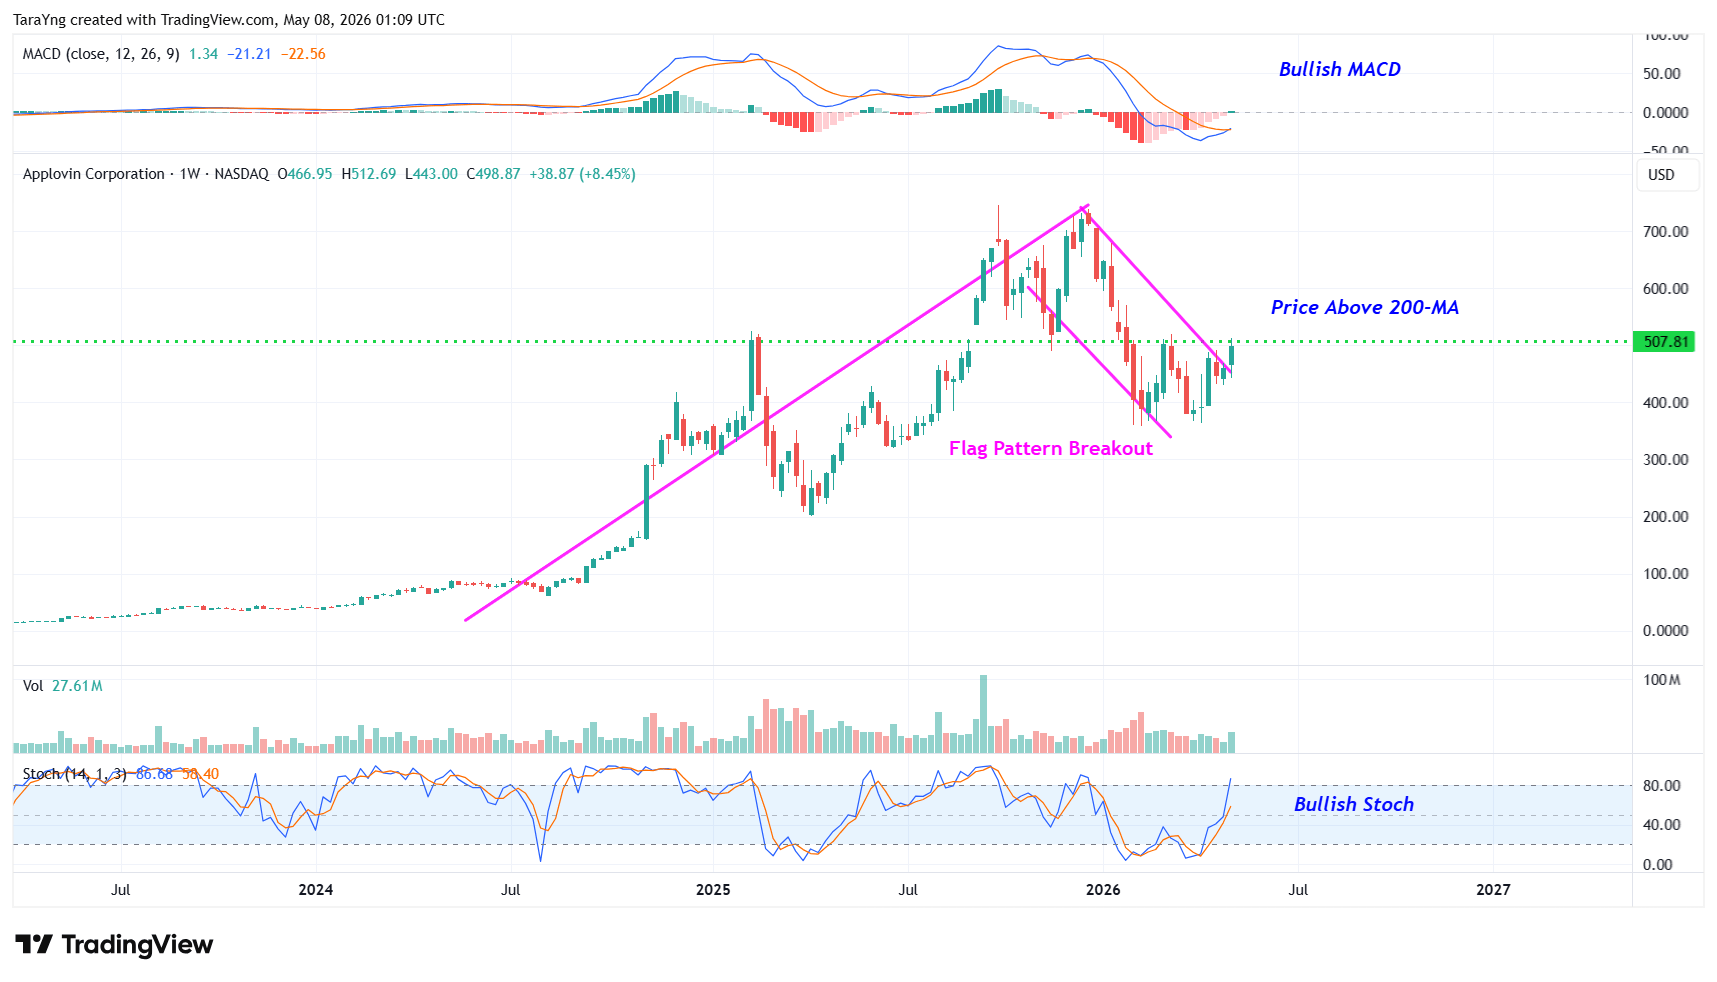
APP – Weekly Chart
#6 Stochastic %K Crossing Above %D: On the weekly chart, the %K line has crossed above the %D line while emerging from oversold territory — a high-conviction combination. A crossover alone can be noise, but when it occurs from an oversold base, it signals that selling pressure is exhausting and buyers are stepping in with conviction. On a weekly timeframe, this signal carries added weight, pointing to a potential longer-term shift in momentum in favor of the bulls.
#7 Bullish MACD: The weekly MACD line has crossed above the signal line, signaling that short-term momentum is now outpacing longer-term momentum and the market’s internal gears are shifting in the bulls’ favor. The histogram flipping from negative to positive confirms that buying pressure is accelerating rather than fading — a structurally important signal on the longer timeframe.
Risks to Consider
Even strong setups can fail, especially in a high-growth AI name like AppLovin trading at a premium valuation. A few things could knock the stock off course:
- A breakdown back below the symmetrical triangle pattern on heavy volume would invalidate the technical setup and likely bring the 50-day SMA into play as the next test
- Negative company-specific news or broader market weakness that triggers rotation out of high-multiple AI and growth names
- Valuation concerns — APP trades at elevated forward multiples post-rally, and any execution miss on Q2 guidance (set at $1.92B–$1.95B) could prompt a sharp re-rating lower
- The universal shelf registration filed on May 7 creates potential dilution risk if AppLovin draws down on it more aggressively than the market currently expects
- Insider selling — notable in prior months, with hundreds of millions in sales in 2025–2026, which can dampen sentiment even when tied to scheduled 10b5-1 plans
- Intense competition from Meta, Google, and other large-scale digital advertising platforms with deep AI investment and existing advertiser relationships
- Concentration risk — while the company is expanding into e-commerce, it still carries heavy exposure to mobile gaming and the shifting policies of Apple and Google on their major platforms
- Macro and regulatory exposure — ad spend is cyclical, and a lingering SEC probe (noted earlier in 2026, status unclear) adds headline risk that could weigh on sentiment in a risk-off environment
The Bottom Line
APP is breaking out of a symmetrical triangle on the daily chart while simultaneously breaking out of a bull flag on the weekly — a dual-timeframe technical setup that historically signals the start of a sustained move higher.
The fundamental story underneath the chart is just as strong: a record $1.557B EBITDA quarter at 85% margins, net income up 109% YoY with $1.3B in free cash flow, and a stock that rallied through a shelf registration filing — a rare tape signal that institutional money is buying into strength, not fading it.
Combine that with a near-term catalyst pipeline stacked with the June Axon global launch, Q2 earnings in August, and the H2 AI Video Ad Generator rollout, and APP looks like one of the more compelling risk-reward setups on the board right now.
If this is a trade you want to get in on, here’s how we’d play it. Below you’ll find our exact entry level, both price targets that imply 10%–16% potential upside, and the stop-loss we’re using to manage the downside.
Recommended Trade Setup
| Item | Detail |
|---|---|
| Buy Level | Above approximately $508.00 |
| Price Target 1 | $560.00 — Potential upside: 10% |
| Price Target 2 | $590.00 — Potential upside: 16% |
| Timeframe | Next 3–6 months |
| Stop-Loss | $480.00 on a closing basis |
If needed, swipe or scroll sideways to view the full table.
For a risk of approximately $28.00 per share, the target rewards are about $52.00 and $82.00 per share. That makes this roughly a 1:2 and 1:3 risk-reward trade. In other words, the setup offers nearly 2x to 3x more potential upside than downside.
Happy Trading!
Tara and Greg
Source: TradesOfTheDay.com
