
CVS Health Corporation (NYSE: CVS) just had a big breakout and looks headed even higher.
As we’ll get to just ahead, the combination of a major Medicare Advantage rate tailwind, a cleaner PBM story, and a fresh technical breakout makes CVS one of the more interesting setups on the board. Here’s what’s going on…
The Themes Behind the Move
CVS is much more than a drugstore chain. In plain English, it’s a giant healthcare platform that combines insurance through Aetna, pharmacy benefit management through Caremark, and a huge retail pharmacy footprint — which means its stock is heavily influenced by healthcare policy, medical-cost trends, and execution across multiple businesses.
CVS’s latest move does not appear to be about one random headline. Instead, traders seem to be reacting to a broader set of developments that are finally starting to tilt more in the company’s favor.
| Theme / Catalyst | What Happened | Why Traders Care |
|---|---|---|
| Medicare Advantage rate relief: CMS drops a lifeline | The Centers for Medicare & Medicaid Services (CMS) just handed Medicare Advantage insurers a massive win. On April 6, 2026, it finalized a 2.5% rate increase for 2027 — obliterating the original 0.09% proposal that had the market sweating. For CVS’s Aetna unit, which is neck-deep in the “graying of America” trade, this isn’t just a bump — it’s a pressure valve on margins that have been getting crushed by surging utilization costs. | Aetna is one of the biggest players in MA — so when reimbursement rates jump, the math changes fast. Fatter rates mean less margin bleed, fewer forced benefit cuts, and a lower chance Aetna pulls out of the markets entirely. This flips a major bear theses on its head and gives CVS room to breathe — and potentially rally. |
| Insulin settlement & PBM pivot | CVS reached a proposed settlement with the FTC over insulin pricing and is accelerating its “CVS CostVantage” model — a shift toward transparent drug pricing that moves away from the opaque PBM structure regulators have had in their crosshairs. Rather than wait for Washington to legislate the old model out of existence, CVS is front-running federal action on its own terms. | Regulatory uncertainty around Caremark, CVS’s PBM arm, has been a persistent headwind for the stock. Settling with the FTC clears a meaningful overhang, and the pivot to transparent pricing shows CVS is adapting proactively. Analysts are treating it as a de-risking event for Caremark — which removes a key argument for the bear case. |
| Retail confidence returning | CVS announced plans to open roughly 60 new locations in 2026 — its first net store growth in years. The mix includes traditional CVS store, Target pharmacy locations, and a new “apothecary-style” pharmacy-only format. After a prolonged stretch of closures and cost-cutting, the company is clearly signaling renewed conviction in its core retail and pharmacy business. | Net store growth is a sentiment shift, not just an operational one. It tells the market that CVS management believes the business has stabilized and is worth investing in again. The new pharmacy-only format is also worth watching — it’s a leaner, higher-margin model that could reshape how the street values the retail segment going forward. |
| Sector sentiment improving / Value trade | Mid-April earnings from UnitedHealth Group delivered better-than-expected medical loss ratios, signaling the industry is getting a handle on cost pressures in 2026. That rising tide has lifted the entire managed care sector — and when the industry leader posts numbers like that, the market tends to extend the benefit of the doubt to peers like CVS. | CVS trades at roughly 11x forward earnings while peers UNH and Humana command 15–20x. That gap is a value trade. As CVS’s 2026 turnaround matures, investors are betting on mean reversion — that the discount narrows as execution improves. It’s a classic catch-up story: cheap multiple, improving fundamentals, sector tailwind at its back. |
| Stable fundamentals backing the story | CVS closed FY 2025 with record revenue of $402.1B — up 7.8% year-over-year — alongside adjusted EPS of $6.75 and $10.6B in operating cash flow. For 2026, management confirmed adjusted EPS guidance of $7.00–$7.20, with the street modeling revenue north of $405B. Not explosive growth, but steady and credible. | At ~11x forward earnings, CVS doesn’t need blowout growth to work as a trade — it needs to stop disappointing. These numbers suggest it can. Record revenue, double-digit cash flow, and confirmed guidance give traders a fundamental floor to lean on while the catalysts play out. The story isn’t just thematic anymore; the balance sheet is starting to back it up. |
| Analyst coverage & price targets leaning bullish | Consensus sits at Moderate Buy to Strong Buy, with 20+ analysts carrying Buy ratings and few dissenting Holds. The average 12-month price target is roughly $95, with a range of $80–$105. Against the April 29 close of $83.90, that implies 13–15% upside to the mean — before any catalyst-driven re-rating. | When 20+ analysts are aligned on Buy with meaningful upside to target, it creates a built-in support structure — institutional money tends to follow conviction at scale. The wide target range ($80–$105) also reflects genuine uncertainty around execution, which is exactly where the opportunity lives. If CVS delivers on even half the catalysts in this table, the street has room to revise targets higher. |
| Upcoming trigger / May 6 is the moment of truth | CVS reports Q1 2026 earnings on May 6 — the first major data point since the CMS rate win and FTC settlement. All eyes are on the medical loss ratio and any updated commentary around cost trends heading into the back half of the year. | This is the print that either validates or unravels the trade thesis. If medical costs are stabilizing, the catalysts stack up. If utilization is still running hot, the bulls have a problem. Every other catalyst on this list gets stress-tested on May 6. |
If needed, swipe or scroll sideways to view the full table.
Put it all together, and CVS is looking less like a managed-care laggard still buried under old concerns and more like a value-oriented healthcare name where the story may finally be starting to improve.
The story may be getting stronger, but the chart is what could determine whether this move has more room to run in the near term. Here are the bullish technical signals traders should be watching now.
Bullish Technical Signals
#1 Downtrend Channel Breakout: After weeks of compression within a well-defined descending channel, which is marked in purple on the daily chart, CVS has broken out to the upside. Channel breakouts of this nature signal a shift in supply/demand dynamics – sellers who previously capped every rally are losing control, opening the door for a sustained move higher.
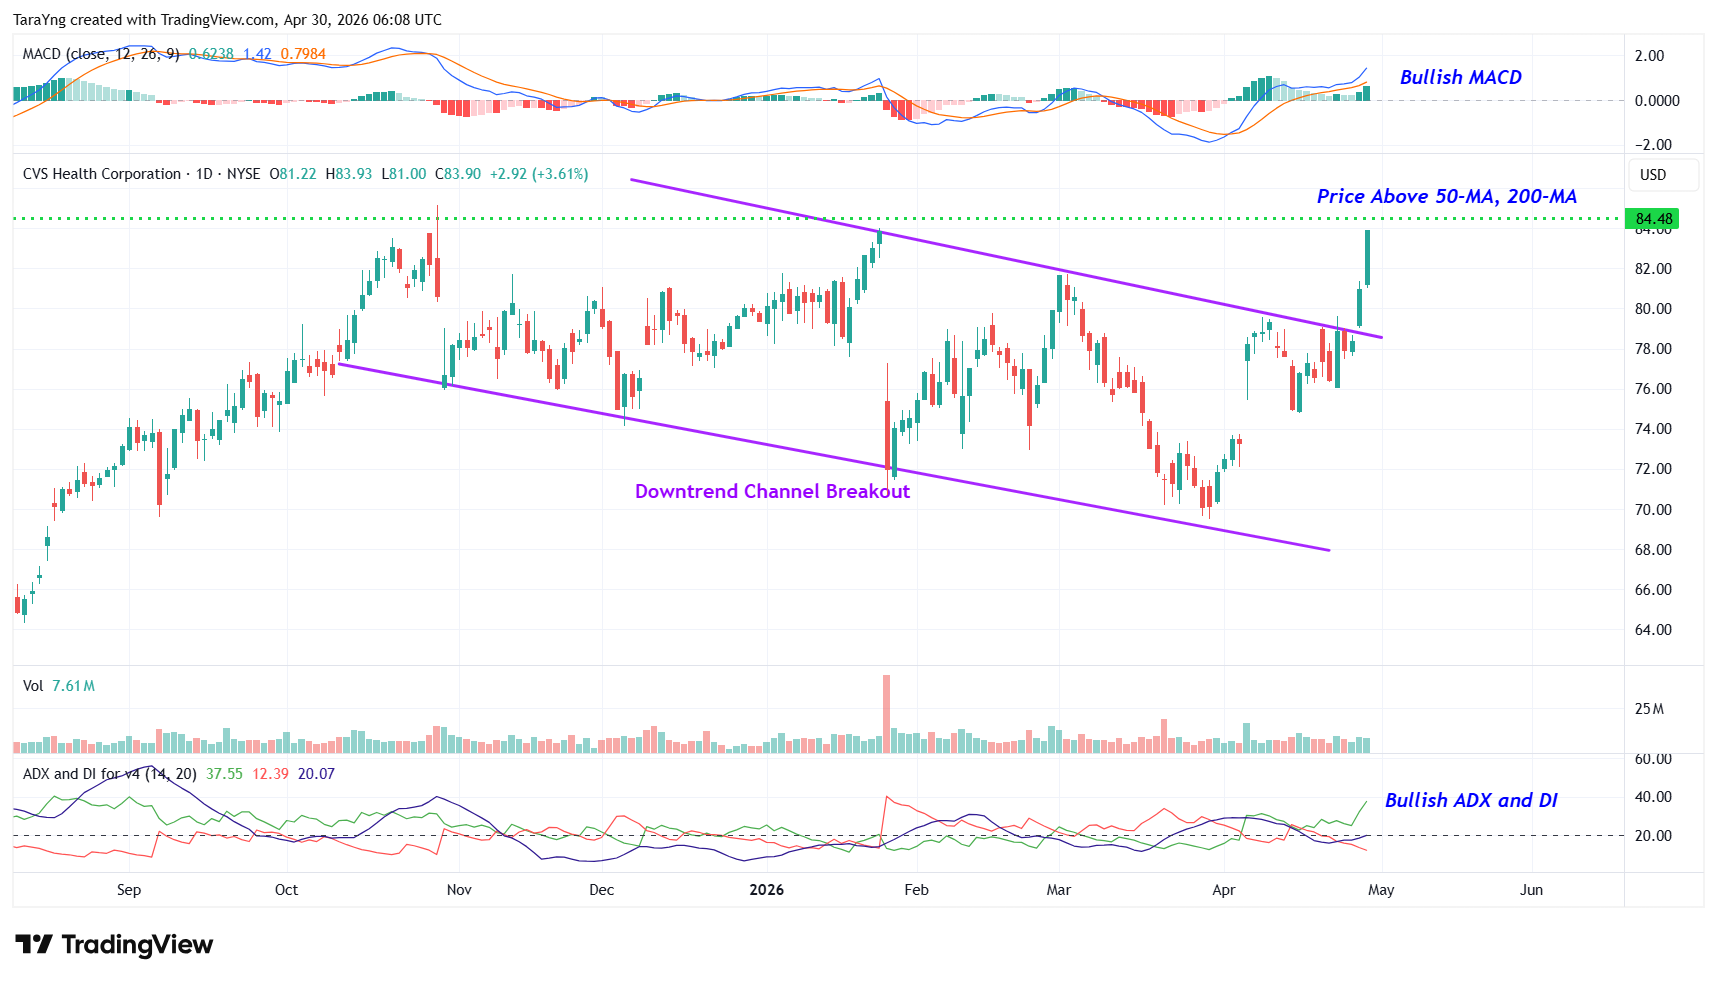
CVS – Daily Chart
#2 Price above MAs: CVS is trading above both its 50-day and 200-day SMAs – a configuration that confirms bulls are in command across both short- and longer-term timeframes. Beyond trend confirmation, these MAs now serve as dynamic support levels, providing a technical floor on any pullbacks.
#3 MACD Above Signal Line: On the daily chart, the MACD line has crossed above the signal line, forming a bullish crossover. This reflects accelerating short-term momentum relative to the longer-term trend – a classic sign that buying pressure is building. For traders, this crossover historically acts as an early entry signal ahead of a potential price advance.
#4 Bullish ADX: The ADX indicator is reinforcing the bullish case on two fronts: the +DI line is above the -DI line, confirming buyers are controlling trend direction, while the ADX line itself is rising toward the +DI, signaling that this is not just a directional shift, but one gaining momentum. Together, these readings point to a high probability of a new or accelerating uptrend.
#5 IH&S Pattern: The weekly chart reveals a textbook Inverted Head & Shoulders pattern. This is one of the most reliable major reversal formations. Formed at the tail end of a prolonged downtrend, the pattern’s three successive troughs (with the deepest at the center “head”) reflect a gradual exhaustion of selling pressure and growing buyer conviction. With CVS now trading above its 50-week and 200-week SMAs as well, the long-term technical picture is firmly shifting bullish.
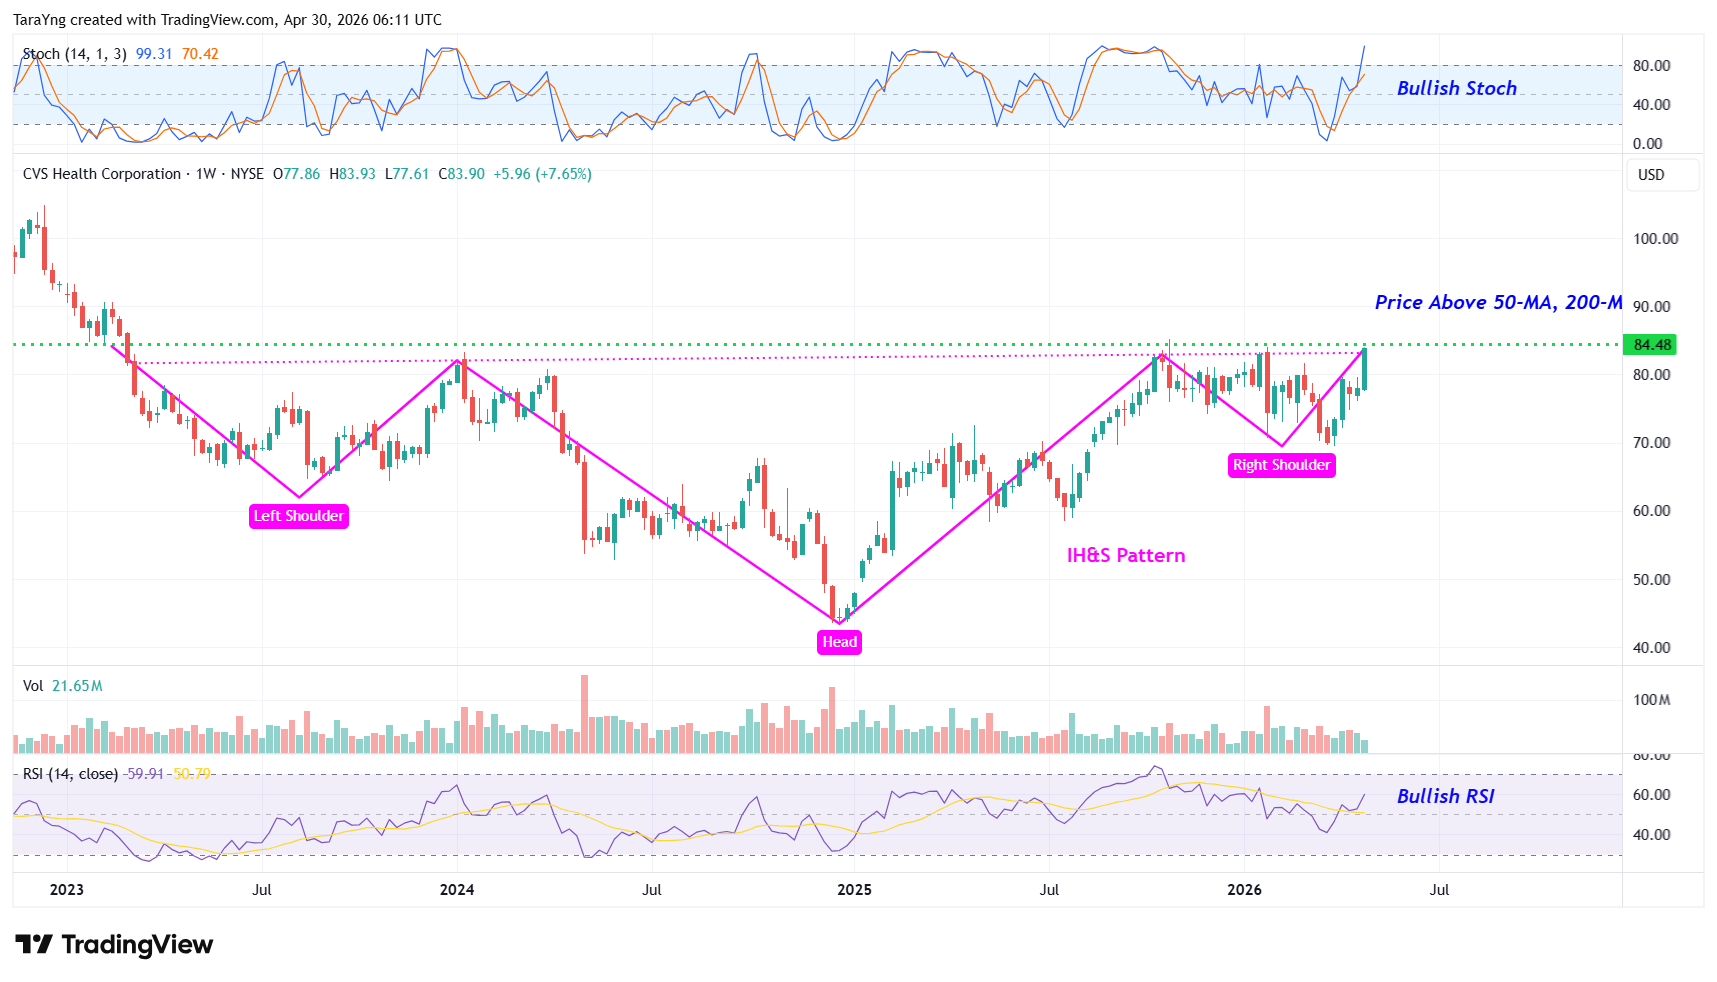
CVS – Weekly Chart
#6 %K above %D: On the weekly chart, the %K line has crossed above the %D line – a signal that buying momentum is overtaking selling pressure on a longer-term basis. Given the weekly timeframe, this crossover carries added weight, suggesting the shift in momentum is meaningful rather than short-lived, and pointing toward a potential long-term buying opportunity.
#7 Bullish RSI: The weekly RSI has cleared the 50 level and continues to trend higher. This is a two-part confirmation. Crossing 50 signals that buyers now hold the momentum advantage over sellers; the continued upward trajectory indicates that momentum is strengthening, not plateauing. This makes the bullish signal more conviction-worthy than an RSI simply sitting at 50.
Recommended Trade Setup
| Item | Detail |
|---|---|
| Buy Level | Above approximately $84.50 |
| Price Target 1 | $93.00 Potential upside: 10% |
| Price Target 2 | $99.00 Potential upside: 17% |
| Timeframe | Next 3–6 months |
| Stop-Loss | $79.90 on a closing basis |
If needed, swipe or scroll sideways to view the full table.
For a risk of approximately $4.60 per share, the target rewards are about $8.50 and $14.50 per share. That makes this roughly a 1:2 and 1:3 risk-reward trade. In other words, the setup offers nearly 2x to 3x more potential upside than downside.
Risks to Consider
Even strong setups can fail, especially in a closely watched healthcare name like CVS. A few things could knock the stock off course:
- A breakdown back below the downtrend channel breakout level on heavy volume
- Negative company-specific news or broader market weakness that pressures healthcare stocks
- Fresh regulatory changes tied to the PBM industry, especially if new transparency rules create more pricing pressure than expected
- A surprise spike in medical costs or senior-care utilization that pushes benefit ratios back in the wrong direction
- Labor friction or localized supply-chain disruptions, even if they do not currently appear material to the overall business
The counterpoint is that CVS has already been moving toward a more transparent pricing model through CostVantage, which may help soften some of the PBM regulatory risk. And unless medical-cost trends worsen unexpectedly, the broader story still looks a lot healthier than it did a year ago.
Happy Trading!
Tara and Greg
Source: TradesOfTheDay.com
