
United States Antimony (NYSE: UAMY) just broke out on increasing volume and looks headed higher.
As we’ll get to just ahead, the combination of a massive U.S. government supply contract, vertical integration and smelter expansion, and a fresh technical breakout makes UAMY one of the more interesting setups on the board. Here’s what’s going on…
The Themes Behind the Move
United States Antimony produces antimony, zeolite, and precious metals. In plain English, it’s one of the few ways for investors to get direct exposure to a mineral that matters for defense, industrial applications, and supply-chain security.
Antimony shows up in things like ammunition, flame retardants, and specialty alloys, which is exactly why Washington cares a lot more about having a reliable domestic source of it now.
UAMY’s latest move does not appear to be about one isolated headline. Instead, traders seem to be reacting to a broader set of themes that have been building underneath the story.
| Theme / Catalyst | What Happened | Why Traders Care |
|---|---|---|
| Defense Logistics Agency (DLA) contract | The company holds a sole-source five-year DLA contract with a total potential value of about $245 million to supply antimony ingots for the U.S. National Defense Stockpile. | It gives UAMY a very visible government-backed demand source that provides a massive revenue floor for the business. It effectively guarantees a buyer for their production, regardless of short-term market fluctuation. |
| Smelter ramp / vertical integration | As of April 2026, the expansion of the Thompson Falls smelter in Montana is complete. This lifts output capacity to roughly 400–500 tons per month. UAMY is now the only fully integrated antimony producer in the Western world (mining, smiling, and refining). | This gives traders a clearer path to more production, better margins, and less dependence on third-party material. |
| China export restrictions | China, which controls 70% of global antimony, has tightened antimony export controls to the U.S. Under current U.S. law, the military is mandated to source these minerals from non-adversarial nations. UAMY has become the “de facto” domestic solution. | That makes UAMY’s domestic antimony footprint more strategically valuable than it looked before. |
| Financial momentum | Fiscal 2025 revenue rose to about $39.3 million, up 163% year over year, while cash and investments climbed to about $91.3 million. | It shows the story is not just thematic — there is real growth underneath it, even if profitability still needs work. |
| Upcoming upside triggers | Traders are watching for Q1 results in early/mid-May, more progress at Thompson Falls and Stibnite Hill, and any additional DLA or Defense Production Act funding. | Those are the kinds of developments that could keep the stock’s momentum alive if execution continues to improve. |
If needed, swipe or scroll sideways to view the full table.
Put it all together, and UAMY is looking less like just another tiny mining stock and more like a high-beta critical-minerals story with real U.S. defense and supply-chain tailwinds behind it.
The story may be getting stronger, but the chart is what could determine whether the stock’s recent breakout has real staying power. Here are the bullish technical signals traders should be watching now.
Bullish Technical Signals
#1 Symmetrical Triangle Pattern Breakout: The daily chart shows UAMY completing a symmetrical triangle, which is a continuation pattern defined by converging descending highs and ascending lows (marked in purple). These patterns reflect a compression of volatility as buyers and sellers reach equilibrium, with the eventual breakout revealing which side wins. UAMY has now broken to the upside, a classic signal that buying pressure has absorbed the supply overhang and momentum is shifting decisively in the bulls’ favor.
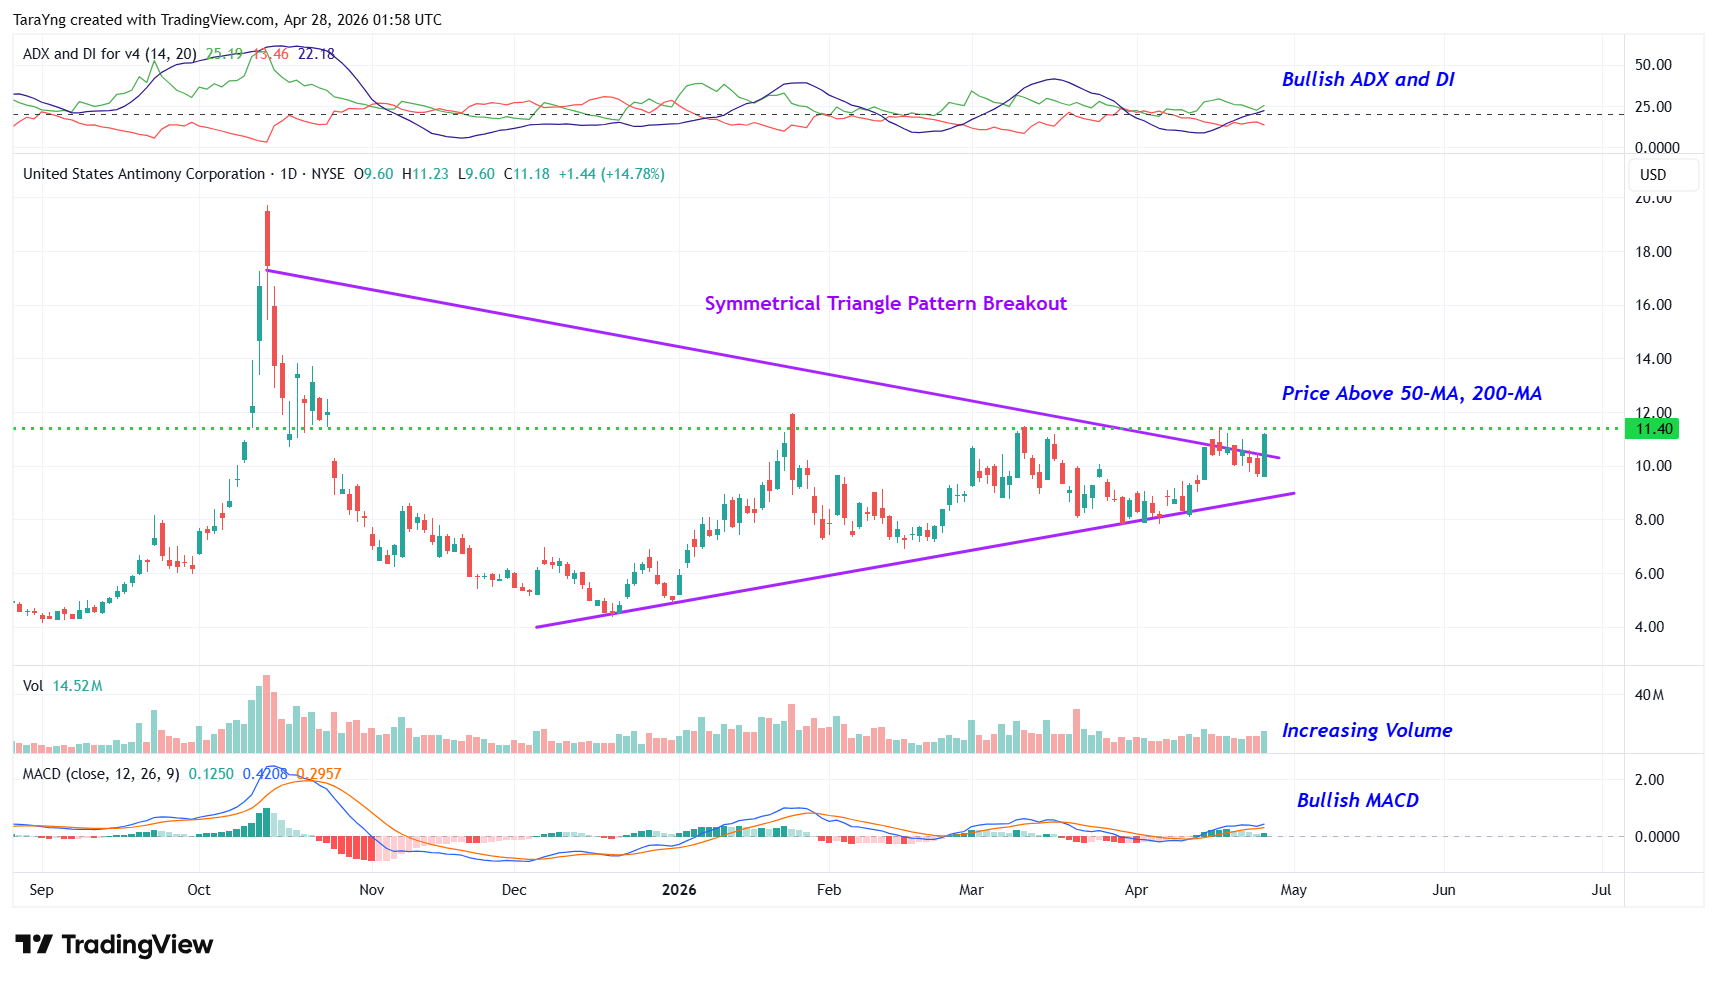
UAMY – Daily Chart
#2 Price above MAs: UAMY is trading above both its 50-day and 200-day SMAs. This is a dual confirmation that the short- and long-term trends are aligned bullishly. Beyond trend direction, these MAs now serve as dynamic support levels, meaning any near-term pullbacks toward them may present favorable re-entry opportunities rather than signs of weakness.
#3 MACD Above Signal Line: On the daily chart, the MACD line has crossed above the signal line, indicating that short-term price momentum is now accelerating faster than its longer-term baseline. This “bullish crossover” reflects a shift in momentum toward the upside and is widely interpreted as a potential buy trigger, suggesting bulls are beginning to assert control over the trend.
#4 Bullish ADX: The ADX indicator adds an important layer of confirmation: the +DI line is above the -DI line (buyers dominating direction), and the ADX line itself is rising from below the -DI toward the +DI. This signals that the trend is actively gaining strength, raising the probability of a sustained or accelerating move higher rather than a brief bounce.
#5 Above Support Area: As you can see from the weekly chart, UAMY has bounced cleanly off a former resistance level that has since flipped to support (pink dotted line). This is a textbook resistance-turned-support confirmation. The stock is also holding above its 50-week and 200-week SMAs, meaning the longer-term structural trend remains intact. This confluence of support gives the current setup a stronger technical foundation than a daily chart alone would suggest.
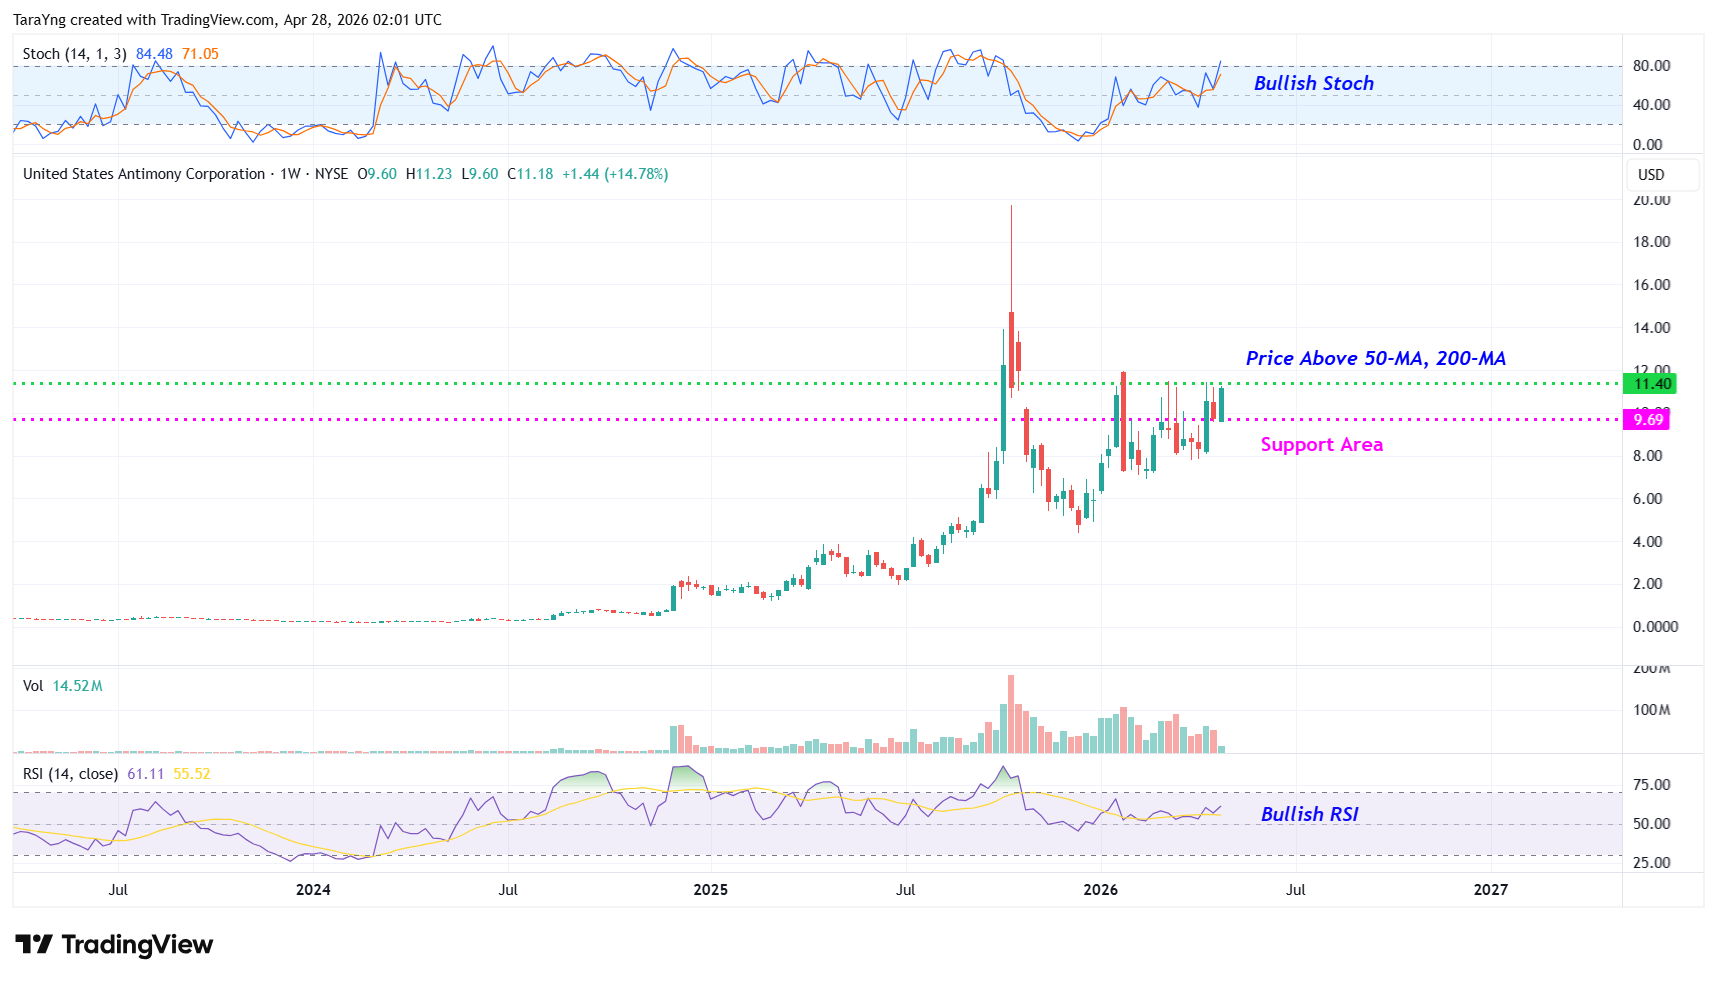
UAMY – Weekly Chart
#6 %K above %D: On the weekly chart, the %K line has crossed above the %D line. When a bullish crossover occurs, it suggests that selling pressure has been exhausted and buyers are stepping in with conviction.
#7 Bullish RSI: The weekly RSI is above the 50 midline and trending higher. Crossing above 50 shows that buying momentum has overtaken selling pressure on a structural level, while the continued upward trajectory indicates that this momentum is strengthening, not stalling. Together, these suggest the current move has room to develop rather than simply being a short-term relief rally.
Recommended Trade Setup
| Item | Detail |
|---|---|
| Buy Level | Above approximately $11.40 |
| Price Target 1 | $13.30 Potential upside: 17% |
| Price Target 2 | $14.70 Potential upside: 29% |
| Timeframe | Next 3–6 months |
| Stop-Loss | $10.30 on a closing basis |
If needed, swipe or scroll sideways to view the full table.
For a risk of approximately $1.10 per share, the target rewards are about $1.90 and $3.30 per share. That makes this roughly a 1:2 and 1:3 risk-reward trade. In other words, the setup offers nearly 2x to 3x more potential upside than downside.
Risks to Consider
Even strong setups can fail, especially in a small-cap critical-minerals name like UAMY. A few things could knock the stock off course:
- A breakdown back below the symmetrical triangle pattern on heavy volume
- Negative company-specific news or broader market weakness that pressures small-cap mining and materials names
- Execution risk around the smelter ramp and mining expansion, especially if weather, permitting, or ore-quality issues slow progress in Montana or Alaska
- Continued operating losses, high expenses, and the possibility of future dilution if growth takes longer than expected to fund itself
- Commodity-price volatility, since antimony prices could cool if global supply loosens
- Uneven quarter-to-quarter revenue, since management has already warned that the timing of large government shipments may create some lumpiness
- Valuation risk, especially if the market starts questioning whether the current backlog and 2026 guidance are enough to justify the stock’s recent run
The counterpoint is that UAMY also has several real supports underneath the story: a large government-backed contract backlog, a strong cash position, policy tailwinds around domestic critical-mineral sourcing, and vertical integration that could meaningfully improve margins if execution continues to improve. On top of that, a $27 million modernization grant from the Pentagon, awarded in March 2026, helps reduce some of the capital burden needed to stabilize and scale operations.
Happy Trading!
Tara and Greg
Source: TradesOfTheDay.com
