
🚨 Trade Update: POET Technologies (NASDAQ: POET)
We recommended POET on April 21, 2026, and it’s already hit both initial price targets. That means the stock has already delivered the original upside targets of 24% and 37%, respectively. At this stage, it’s worth reassessing the position based on your own risk tolerance and trading style.
Active traders: Consider continuing to hold the position with a trailing stop near $11.00, as the recent breakout from the uptrend channel suggests the stock could still have more room to run. If momentum holds, the next potential upside targets are $14.20 and $16.00.
Conservative traders: With both original targets already achieved, this could be a logical spot to lock in profits and step aside.
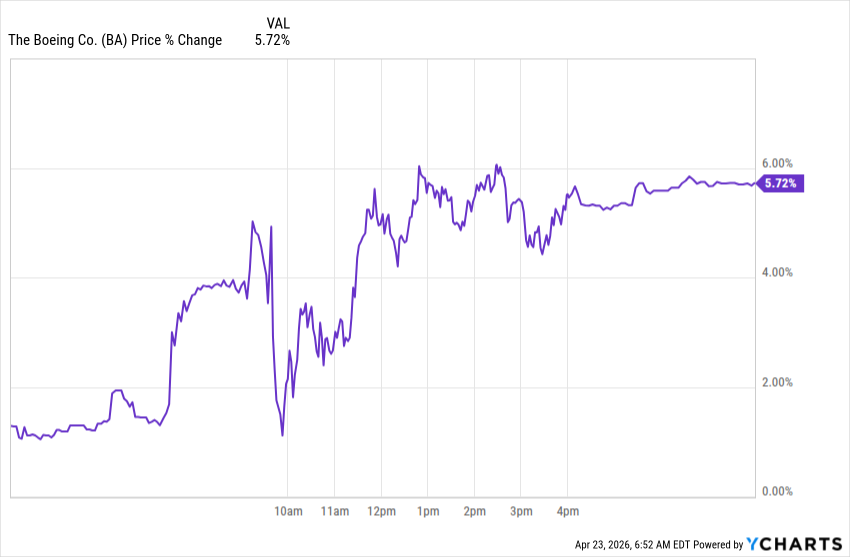
The Boeing Company (NYSE: BA) just broke out on high volume and could keep running.
The combination of improving execution, commercial and defense demand, and a fresh technical breakout makes it one of the more interesting setups on the board. Here’s what’s going on…
The Themes Behind the Move
Boeing builds commercial airplanes, defense systems, and aerospace hardware. In plain English, it sits at the center of two big global markets that still matter a lot right now: air travel demand and defense spending.
Boeing’s latest move doesn’t look tied to just one headline. Instead, traders seem to be reacting to a broader set of themes that have been building underneath the story.
| Theme / Catalyst | What Happened | Why Traders Care |
|---|---|---|
| Operational stabilization | Boeing reported Q1 revenue of about $22.2B, up 14% year over year, while core loss per share came in much better than expected. | It suggests Boeing may finally be regaining some operational footing after years of production and quality setbacks. |
| Commercial order momentum | Ethiopian Airlines converted options for six 787 Dreamliners into firm orders. | It reinforces demand for Boeing’s widebody lineup and adds support to the commercial aircraft story. |
| Defense and backlog tailwind | Boeing’s defense business is benefiting from modernization spending, while total backlog stands near a record $695B. | It gives investors a huge base of future demand to focus on, even before new orders show up. |
| Debt reduction / balance-sheet progress | The company reduced total debt by roughly $6.9B in Q1. | That helps reinforce the idea that Boeing is not just surviving — it may actually be getting healthier financially. |
| Upcoming upside triggers | Traders are watching for a possible China order, higher 737 production rates, and future FAA certifications. | Those are the kinds of developments that could keep the stock’s momentum alive if the broader story keeps improving. |
If needed, swipe or scroll sideways to view the full table.
Put it all together, and Boeing is looking less like a turnaround story people hope might work and more like a large industrial name where the fundamentals may finally be starting to catch up with the narrative.
The story may be getting stronger, but the chart is what could determine whether this move has real staying power. Here are the bullish technical signals traders should be watching now.
Bullish Technical Signals
#1 Symmetrical Triangle Pattern Breakout: On the daily chart, Boeing just broke out of a Symmetrical Triangle pattern. This is a classic continuation formation defined by two converging trendlines that compress price action between a series of lower highs and higher lows (marked in purple). Breakouts from this pattern typically signal a resumption of bullish momentum, and the current move above the upper trendline suggests buyers are beginning to reassert control.
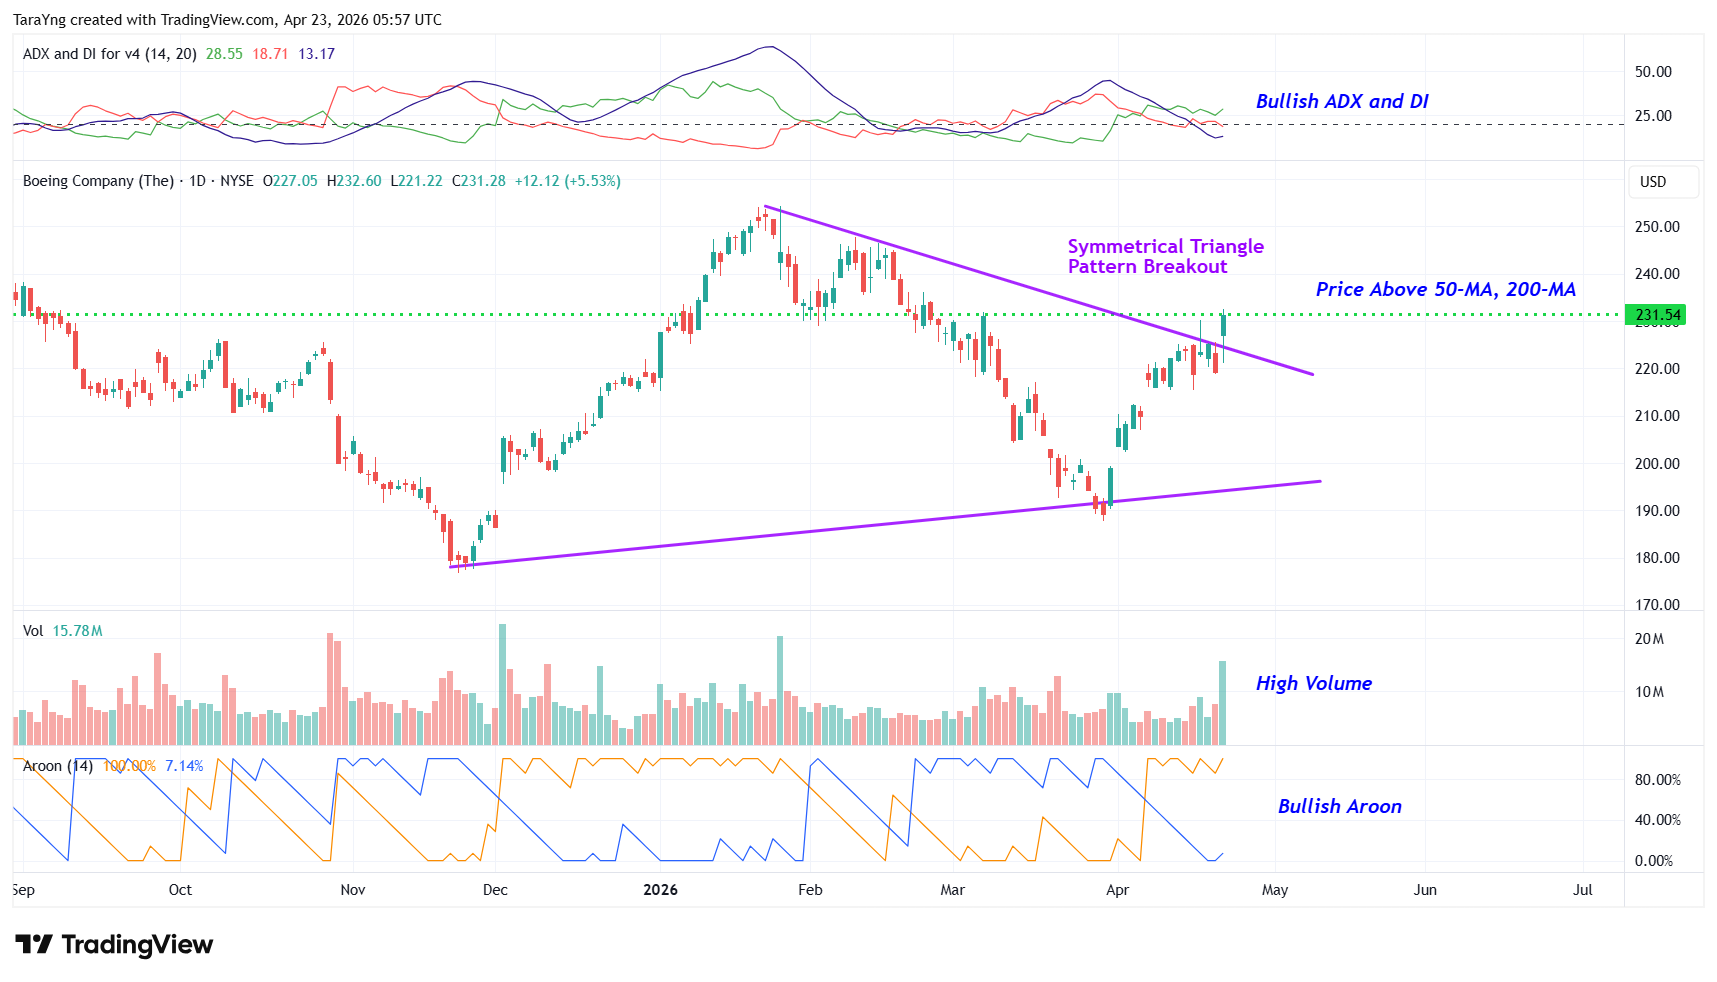
BA – Daily Chart
#2 Price above MAs: Adding to the bullish case, price is now trading above both the 50-day and 200-day simple moving averages. This is a meaningful technical milestone. Holding above these two widely-watched levels suggests the intermediate and longer-term trend remains in the bulls’ favor.
#3 Bullish ADX: The ADX indicator reinforces this view. The +DI line is currently positioned above the –DI line, and the ADX itself has begun to turn higher from below both DI lines. This is a configuration that often marks the early stages of a strengthening uptrend rather than a mere bounce.
#4 Bullish Aroon: The Aroon indicator adds a further layer of confirmation. The Aroon Up (orange) is reading above 70 while the Aroon Down (blue) sits below 30. This is a spread that points to fresh upside momentum and suggests the recent price strength is unlikely to be a fleeting move.
#5 Bouncing from a Key Support Zone: As viewed from the weekly chart, the broader picture is equally encouraging. Boeing has rebounded convincingly from a well-established resistance-turned-support level (marked in pink), a zone that has historically acted as a meaningful floor. With price also holding above both the 50-week and 200-week SMAs, the long-term technical structure remains constructive.
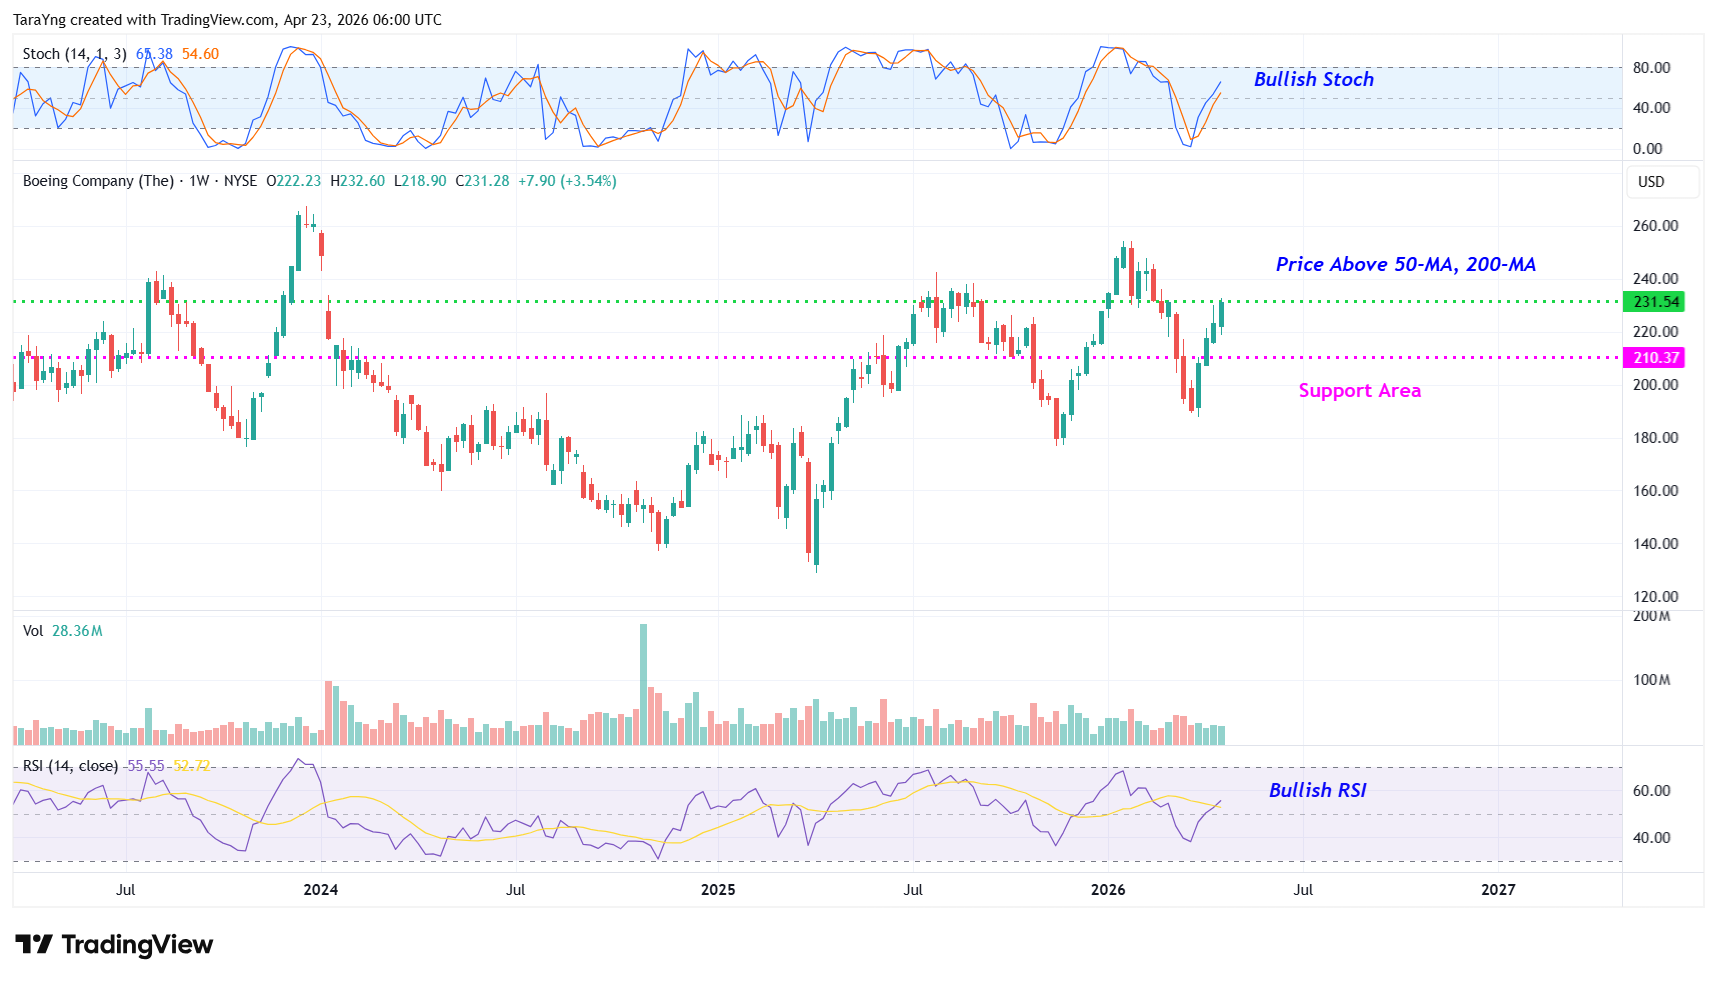
BA – Weekly Chart
#6 %K above %D: The weekly Stochastic indicator offers a timely confirmation signal. The %K line (blue) has crossed above the %D line (orange) while recovering from oversold levels. This is a crossover that, on a weekly timeframe, carries added weight and suggests a more sustained move higher may be underway.
#7 Bullish RSI: Rounding out the weekly picture, the RSI is currently above the key 50 midline and trending higher. This positioning indicates that momentum is tilting in the bulls’ favor on a longer-term basis, supporting the case for continued upside.
Recommended Trade Setup
| Item | Detail |
|---|---|
| Buy Level | Above approximately $232.00 |
| Price Target 1 | $260.00 Potential upside: 12% |
| Price Target 2 | $280.00 Potential upside: 21% |
| Timeframe | Next 3–6 months |
| Stop-Loss | $216.00 on a closing basis |
If needed, swipe or scroll sideways to view the full table.
For a risk of approximately $16.00 per share, the target rewards are about $28.00 and $48.00 per share. That makes this roughly a 1:2 and 1:3 risk-reward trade. In other words, the setup offers nearly 2x to 3x more potential upside than downside.
Risks to Consider
Even strong setups can fail, especially in a stock as closely watched as Boeing. A few things could knock BA off course:
- A breakdown back below the symmetrical triangle pattern on heavy volume
- Negative company-specific news or broader market weakness that pressures industrial and aerospace names
- Further delays in FAA certification for the 737-7 and 737-10, which could push out higher-margin deliveries
- Ongoing supply-chain bottlenecks — especially around the 787 program — that could cap delivery growth
- Continued scrutiny around Boeing’s quality-control track record and execution
- Heavy competition from Airbus, especially in the narrowbody market
- Valuation concerns, given that Boeing is still working through commercial losses and a heavy debt load, even if free cash flow is improving
- Macro headwinds like higher jet-fuel prices or a broader economic slowdown that could weigh on airline demand and future orders
The counterpoint is that a number of these concerns may already be reflected in the stock. Boeing’s backlog remains enormous, production appears more stable than it was a year ago, and investors are increasingly focused on whether free cash flow and execution continue to improve.
Happy Trading!
Tara and Greg
Source: TradesOfTheDay.com
