
The Strait of Hormuz is far from a resolved story. Tensions re-escalated over the weekend, shipping risk in the Gulf is back in focus, and traders need to treat the Iran/U.S. backdrop as an active market wildcard again — not old news.
That matters for this week’s watchlist because some of these names were helped by the same backdrop that lifted Bitcoin, semiconductors, and high-beta momentum names this past week. But not every stock on this list is equally exposed. Some have cleaner, self-contained catalysts that should matter more than the macro backdrop, while others could be much more vulnerable if sentiment turns defensive again.
So this week is really about separating the names with durable stories from the ones that may have simply been riding the tide. We’ll break that down in a moment. First, here are the 10 stocks we’re watching this week.
The Top 10 Stocks to Watch This Week for Possible Breakouts
| Sl # | Name of the Stock | Stock Ticker | Last Close | Buy Level(s) | Reason |
|---|---|---|---|---|---|
| 1 | Critical Metals Corp. | NASDAQ: CRML | $12.56 | $13.30 | Symmetrical Triangle Pattern |
| 2 | Infleqtion Inc. | NYSE: INFQ | $17.42 | $18.20 | Downtrend Channel Breakout |
| 3 | NextNav Inc. | NASDAQ: NN | $22.83 | $22.90 | Breakout From Consolidation Area |
| 4 | Strategy Inc. | NASDAQ: MSTR | $166.52 | $170.00 | Falling Wedge Pattern Breakout |
| 5 | Rocket Lab Corp | NASDAQ: RKLB | $84.80 | $87.70 | Symmetrical Triangle Pattern Breakout |
| 6 | Cipher Digital Inc. | NASDAQ: CIFR | $19.37 | $19.70 | Downtrend Channel Breakout |
| 7 | Trevi Therapeutics Inc. | NASDAQ: TRVI | $15.23 | $15.40 | Breakout From Consolidation Area |
| 8 | Oklo Inc. | NYSE: OKLO | $66.81 | $69.20 | Falling Wedge Pattern Breakout |
| 9 | Alpha & Omega Semiconductor Ltd | NASDAQ: AOSL | $33.88 | $35.50 | Symmetrical Triangle Pattern Breakout |
| 10 | Summit Therapeutics Inc. | NASDAQ: SMMT | $25.15 | $25.60 | Downtrend Channel Breakout |
If needed, swipe or scroll sideways to view the full table. Important: Typically, these trades offer a risk/reward ratio of about 1:2 or 1:3 over the next six months, which implies roughly 2x to 3x more potential reward than risk. Be sure to set your stop-loss levels and target prices accordingly to manage your risk. Also note that these trade ideas are triggered using daily closing prices, not intra-day pricing — so if you participate in these trades, make sure the stock closes above the recommended buy level first.
Before we go through the setups one by one, it’s worth taking a closer look at how the latest Iran/U.S.-related backdrop could affect this group. Some of these stocks have company-specific catalysts that should matter more than the macro noise, while others may be much more exposed to a risk-off shakeout if the headlines worsen.
How the Iran/U.S. Backdrop Could Affect This Week’s Setups
| Ticker | Primary Catalyst | Backdrop Sensitivity | Risk Level |
|---|---|---|---|
| CRML | Rare earths deal | Low — company-specific story; geopolitical tension may even help the thesis | 🟢 Low |
| INFQ | Analyst initiation + quantum/AI tie-in | Moderate — mostly company-driven, but still vulnerable to speculative-tech sentiment | 🟡 Moderate |
| NN | Analyst upgrade + FCC progress | Low — mostly insulated; navigation-resilience theme may even gain relevance | 🟢 Low |
| MSTR | Bitcoin strength | High — heavily tied to Bitcoin and broad risk sentiment | 🔴 High |
| RKLB | Product launch + policy tailwind | Moderate — real catalyst, but still exposed to broader growth-stock swings | 🟡 Moderate |
| CIFR | Bitcoin strength + AI/HPC angle | High — still highly tied to Bitcoin and risk appetite | 🔴 High |
| TRVI | Post-offering rebound | Moderate — mostly self-contained biotech story, but still sentiment-sensitive | 🟡 Moderate |
| OKLO | Policy catalyst + AI power theme | Low — energy-independence and nuclear themes may strengthen if tensions stay elevated | 🟢 Low |
| AOSL | India production ramp + AI angle | Moderate — company catalyst is real, but semis can still get pulled around by the tape | 🟡 Moderate |
| SMMT | FDA filing win + bullish analyst coverage | Moderate — mostly company-driven, but still sensitive to biotech risk appetite | 🟡 Moderate |
If needed, swipe or scroll sideways to view the full table.
The cleanest stories this week are still the names with clear, company-specific or policy-driven catalysts. Meanwhile, the Bitcoin proxies and a few of the pure momentum names look much more vulnerable if the macro backdrop deteriorates. In other words, this table isn’t here to replace the technical setups below — it’s here to help traders think more clearly about which names may be more durable and which ones may be more fragile if the tape gets choppy.
That said, here are the top 10 stocks to watch for a breakout, in no particular order.
#1 Critical Metals Corp. (NASDAQ: CRML)
Sector: Basic Materials • Other Industrial Metals & Mining
Reason: Formation of a Symmetrical Triangle Pattern
A symmetrical triangle is a chart pattern formed by two converging trend lines connecting a series of sequential peaks and troughs. These two lines result in the formation of a triangle that appears to be symmetrical.
A symmetrical triangle pattern is usually formed when there is indecision in the price movements and there is uncertainty among the buyers and sellers. This chart pattern represents a period of consolidation before the price breaks out or breaks down. In case a breakout occurs from the upper trend line, it is a strong bullish indication as it signifies the start of a new bullish trend.
Buy Level(s): The ideal buy level for CRML is if the stock has a daily close above the breakout level of the symmetrical triangle pattern, at around $13.30. This is marked in the chart below as a green color dotted line.
Daily chart – CRML
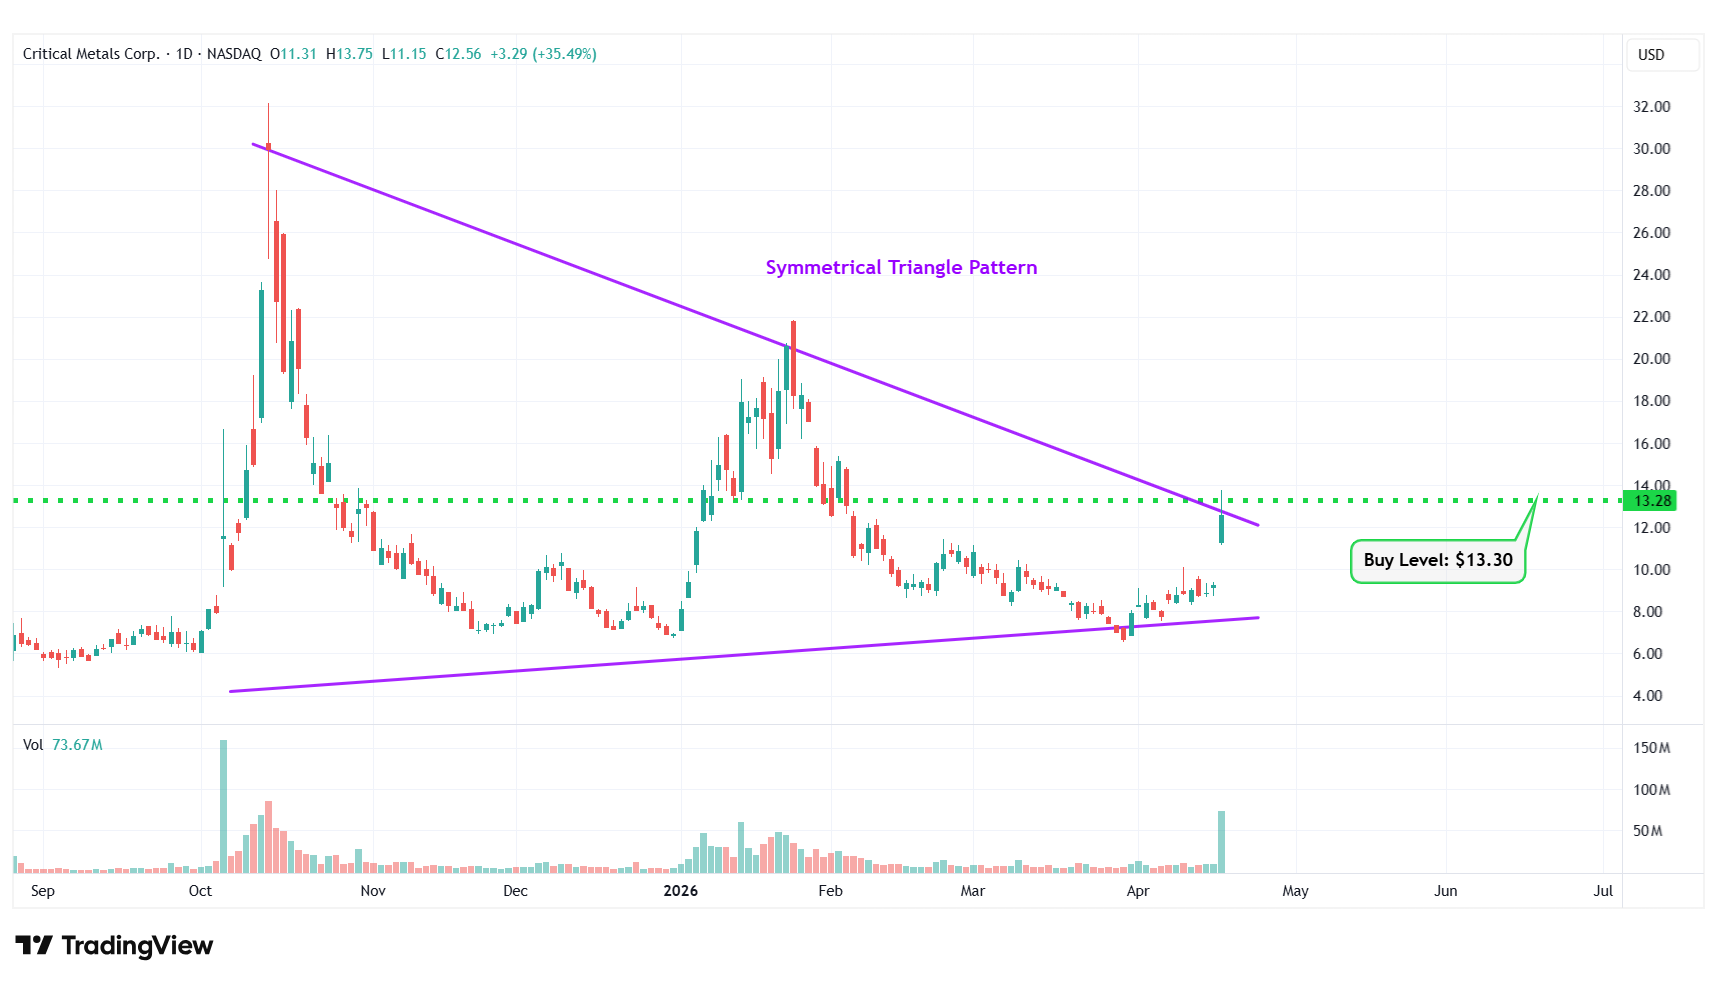
CRML – Symmetrical Triangle Pattern
#2 Infleqtion Inc. (NYSE: INFQ)
Sector: Technology • Software – Infrastructure
Reason: Downtrend Channel Breakout
A downtrend or descending channel is the price action contained between downward sloping parallel lines. It is formed by two lines that are drawn by connecting the lower highs and lower lows of a stock’s price. Even though this is typically a bearish pattern, a breakout from the upper rail of this pattern is considered a good bullish indication.
Buy Level(s): The daily chart shows that the stock has currently broken out of a downtrend channel. However, there is a near-term resistance level for the stock. Hence, the ideal buy level for INFQ is if the stock has a daily close above $18.20. This is marked in the chart below as a green color dotted line.
Daily chart – INFQ
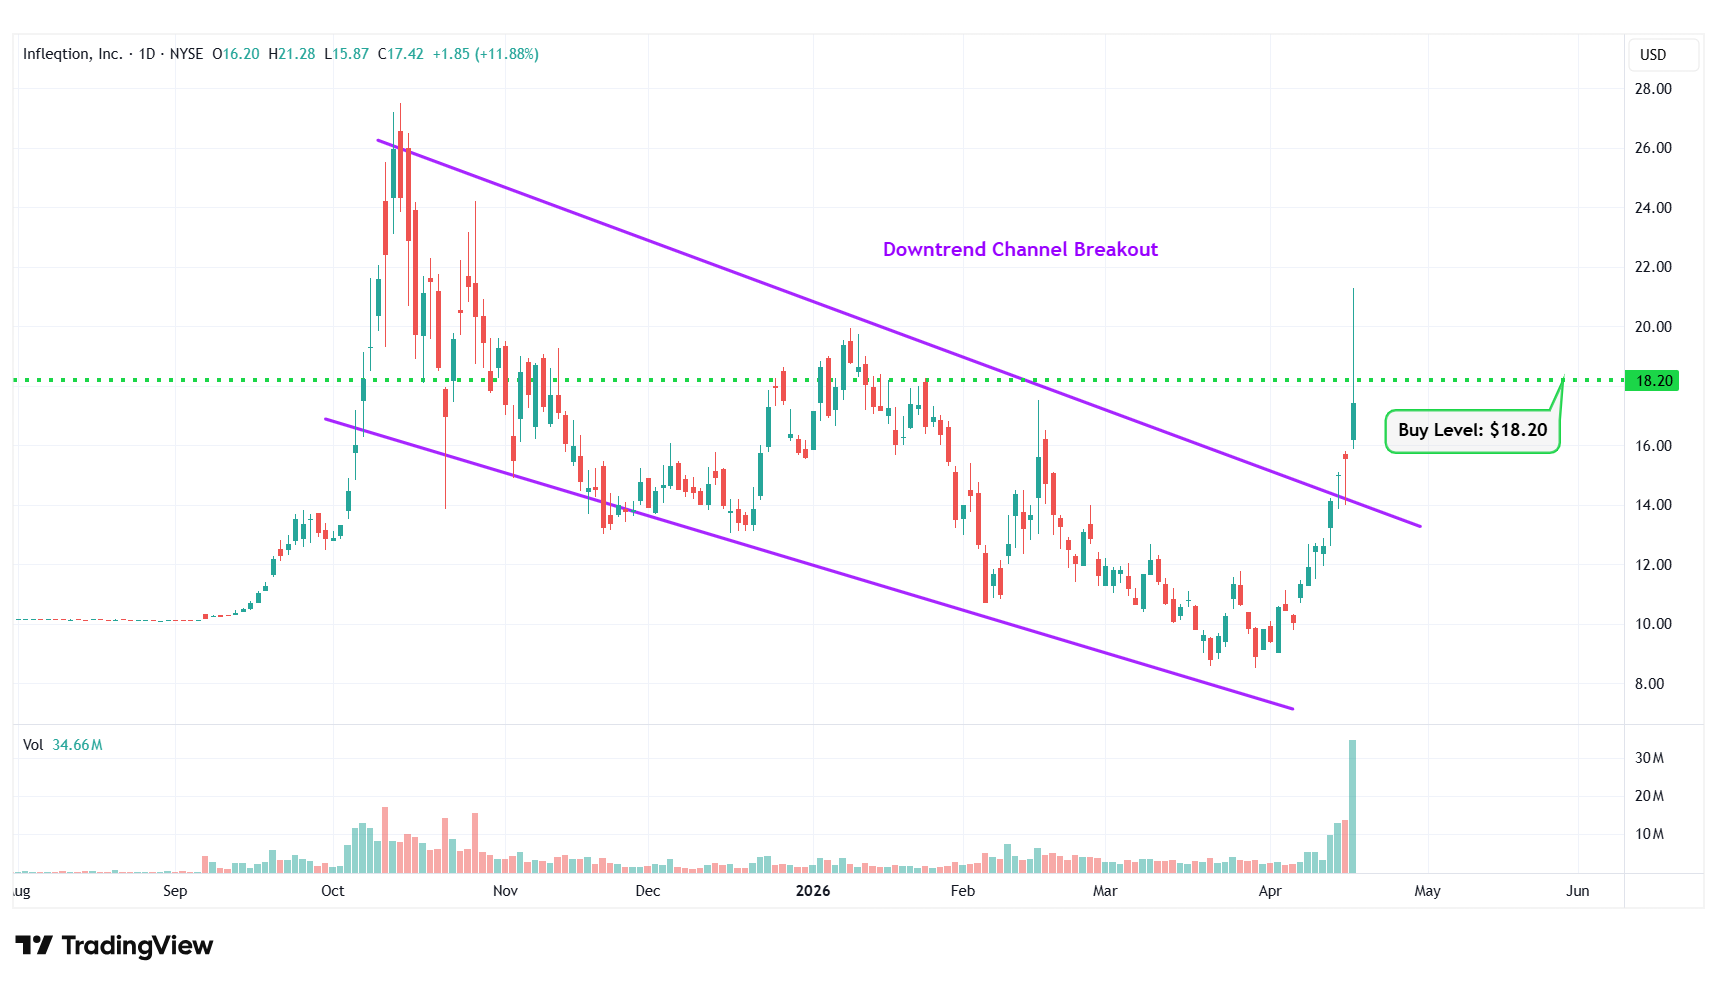
INFQ – Downtrend Channel Breakout
#3 NextNav Inc. (NASDAQ: NN)
Sector: Technology • Software – Infrastructure
Reason: Breakout From a Consolidation Area in the Daily Chart
A Consolidation Area is a price action contained between two parallel lines. It is formed by a lower line that connects the lows, and an upper line that joins the highs. A stock usually trades between the two lines of the consolidation area before finally breaking out from the upper rail.
Buy Level(s): Although the stock has currently broken out of a consolidation area, the ideal buy level for NN is above the near-term resistance area, which translates to a price of around $22.90. This is marked in the chart below as a green color dotted line.
Daily chart – NN
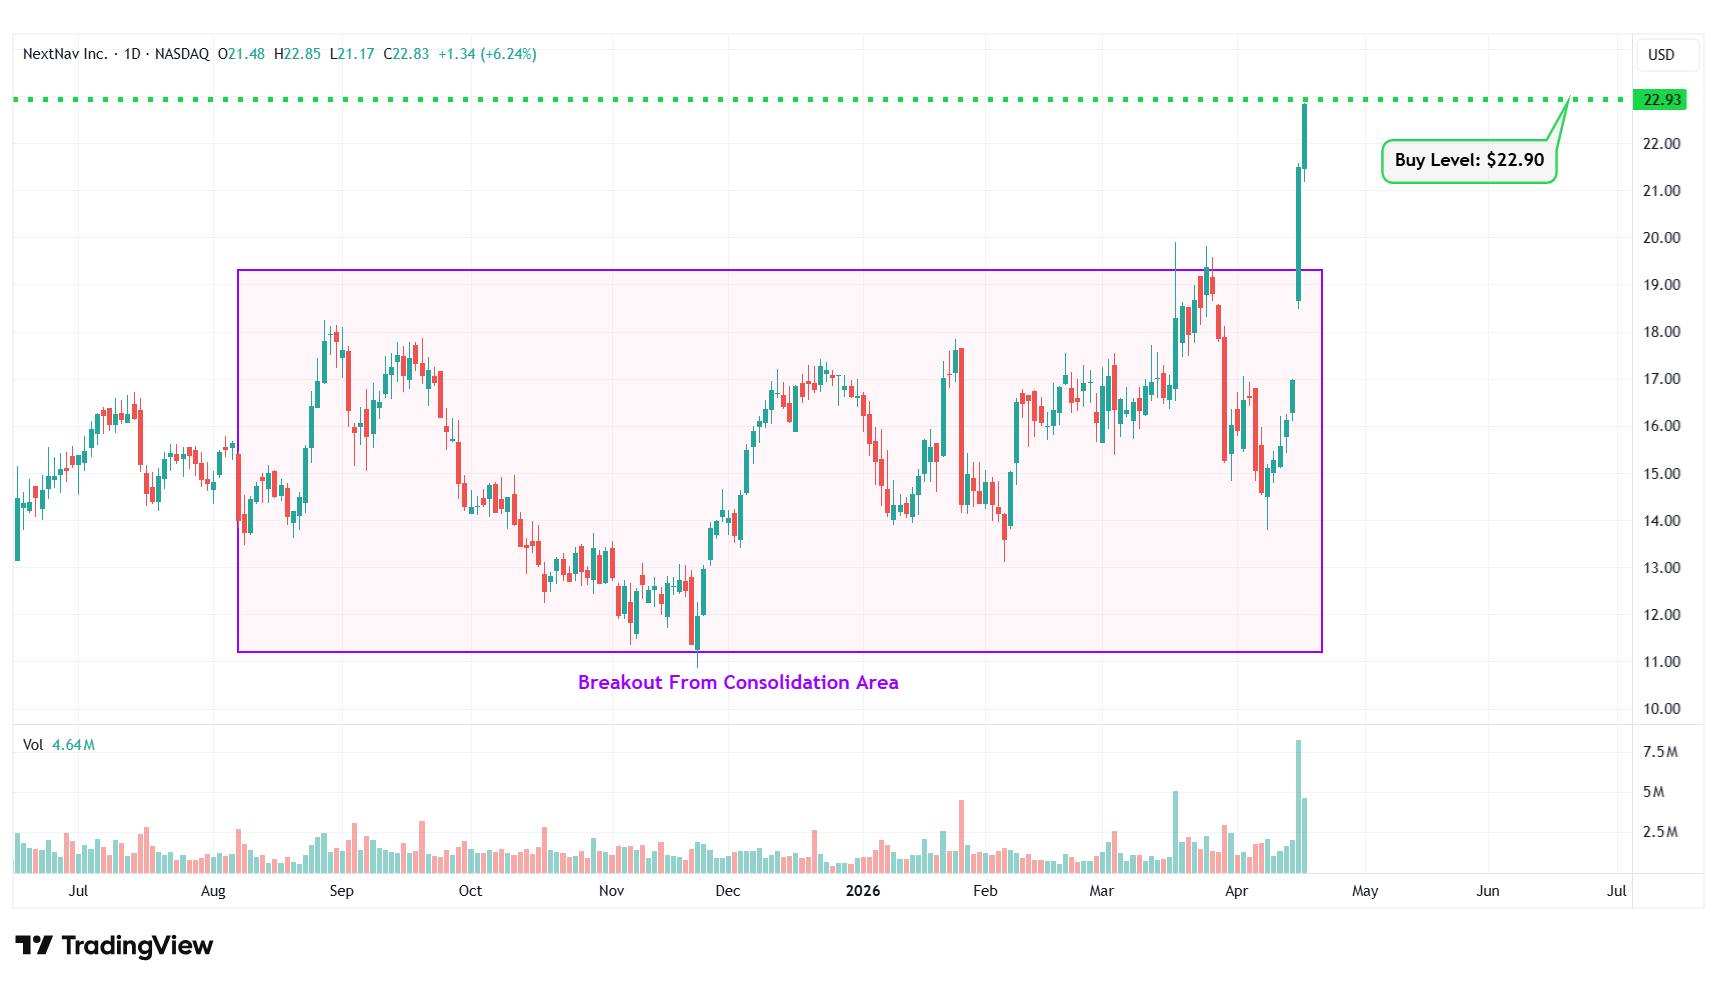
NN – Breakout From Consolidation Area
#4 Strategy Inc. (NASDAQ: MSTR)
Sector: Technology • Software – Application
Reason: Falling Wedge Pattern Breakout
A falling wedge pattern is formed by joining two downward-sloping, converging trendlines having a contracting range. The pattern appears to be wide at the top and continues to contract as prices fall. A breakout from a falling wedge pattern can indicate either reversal or continuation, depending on where the pattern appeared in the trend.
A stock that has broken out of a falling wedge pattern would have gained momentum and would have the potential to move higher.
Buy Level(s): The stock has currently broken out of a falling wedge pattern. However, the ideal buy level for MSTR is above the nearest resistance level of $170.00. This is marked in the chart below as a green color dotted line.
Daily chart – MSTR
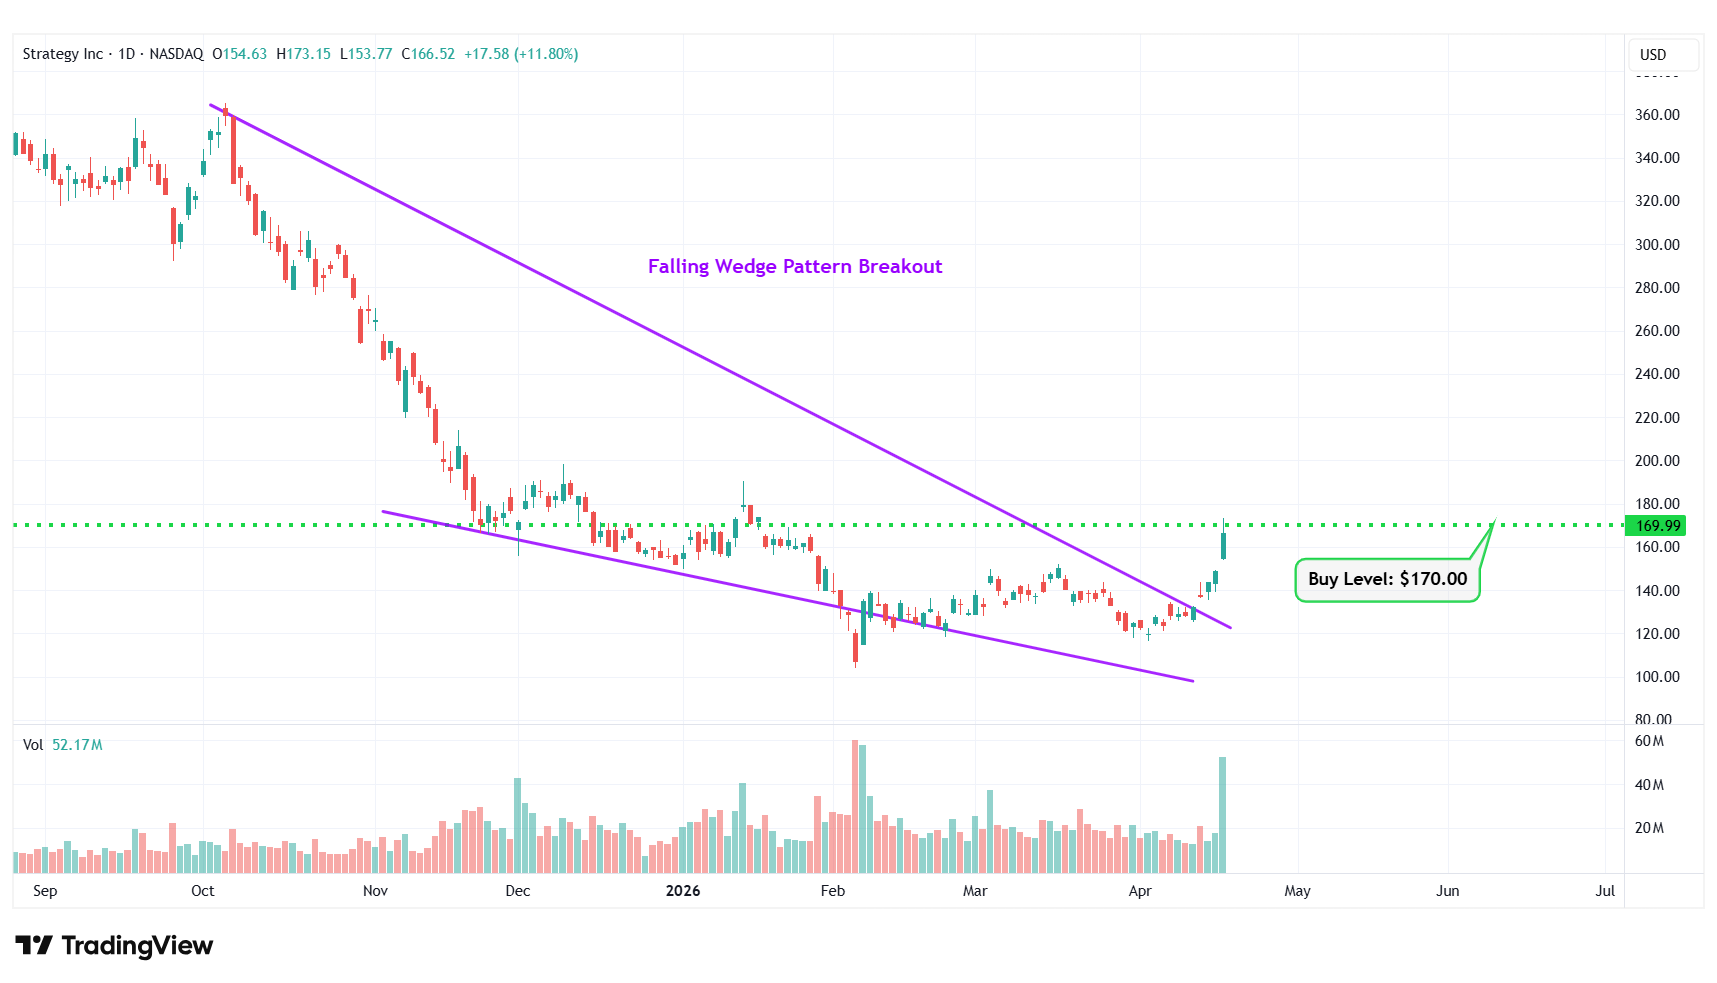
MSTR – Falling Wedge Pattern Breakout
#5 Rocket Lab Corp (NASDAQ: RKLB)
Sector: Industrials • Aerospace & Defense
Reason: Symmetrical Triangle Pattern Breakout
A symmetrical triangle is a chart pattern formed by two converging trend lines connecting a series of sequential peaks and troughs. These two lines result in the formation of a triangle that appears to be symmetrical.
A symmetrical triangle pattern is usually formed when there is indecision in the price movements and there is uncertainty among the buyers and sellers. This chart pattern represents a period of consolidation before the price breaks out or breaks down. In case a breakout occurs from the upper trend line, it is a strong bullish indication as it signifies the start of a new bullish trend.
Buy Level(s): The stock has currently broken out of a symmetrical triangle pattern. However, the ideal buy level for RKLB is if the stock closes above the immediate resistance level of $87.70. This is marked in the chart below as a green color dotted line.
Daily chart – RKLB
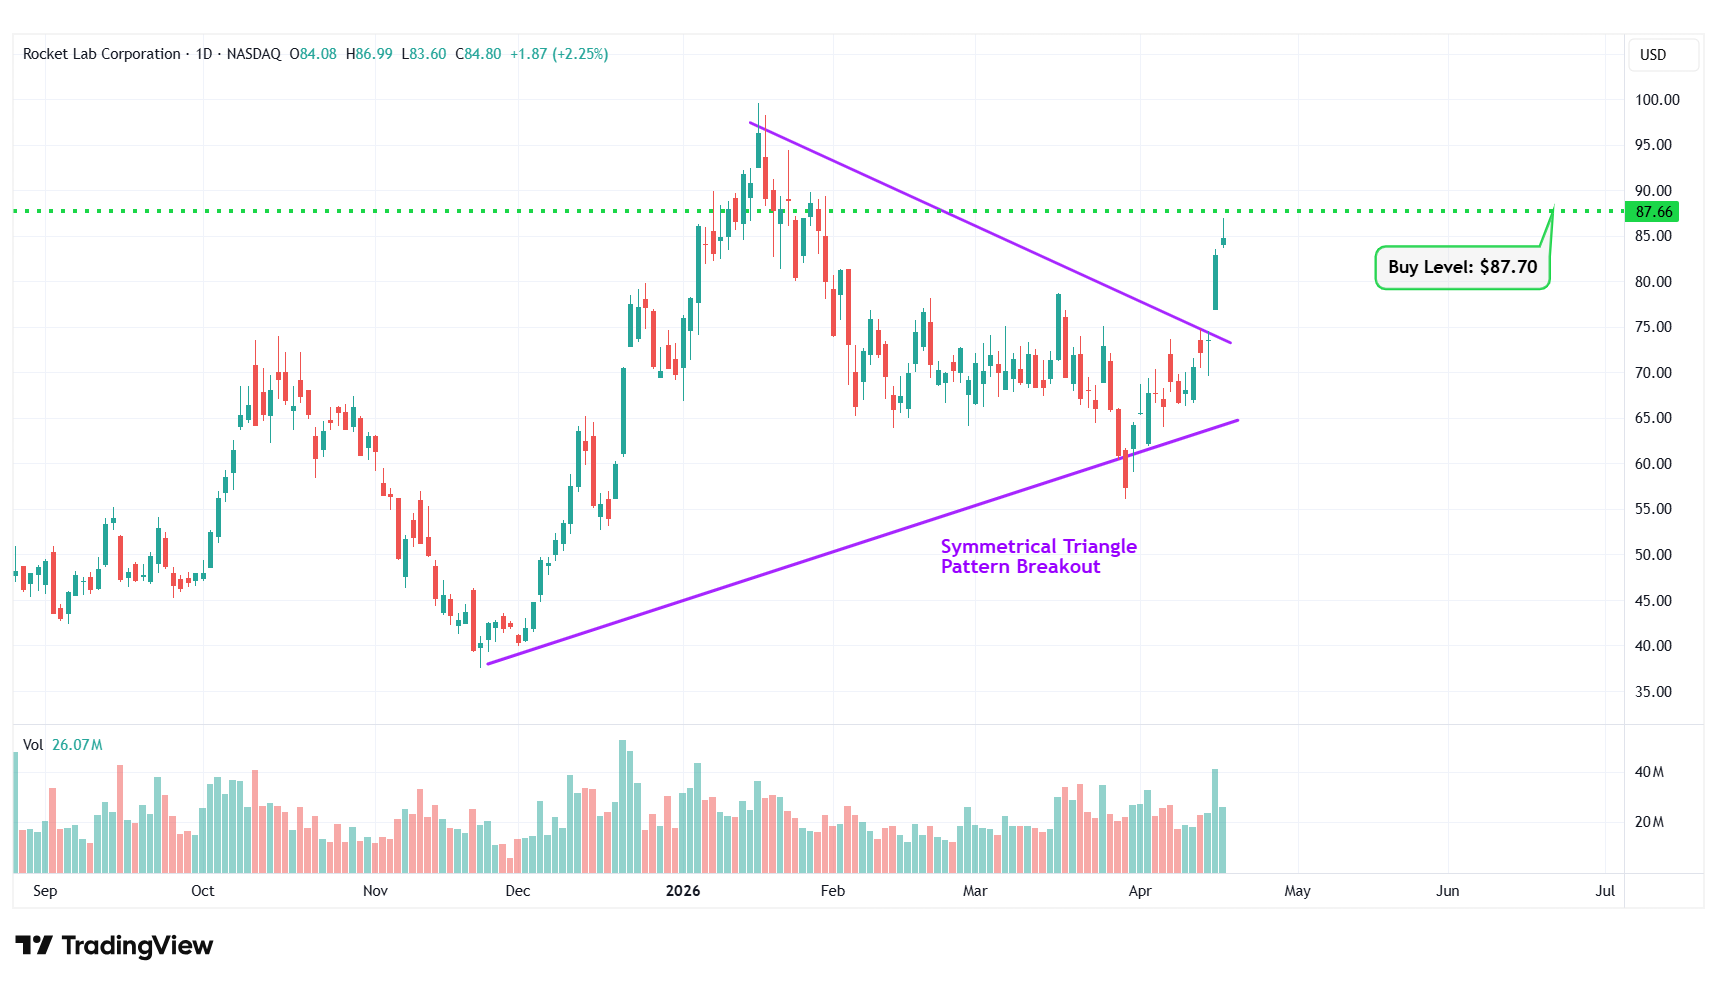
RKLB – Symmetrical Triangle Pattern Breakout
#6 Cipher Digital Inc. (NASDAQ: CIFR)
Sector: Technology • Information Technology Services
Reason: Downtrend Channel Breakout
A downtrend or descending channel is the price action contained between downward sloping parallel lines. It is formed by two lines that are drawn by connecting the lower highs and lower lows of a stock’s price. Even though this is typically a bearish pattern, a breakout from the upper rail of this pattern is considered a good bullish indication.
Buy Level(s): The daily chart shows that the stock has currently broken out of a downtrend channel. However, there is a near-term resistance level for the stock. Hence, the ideal buy level for CIFR is if the stock has a daily close above $19.70. This is marked in the chart below as a green color dotted line.
Daily chart – CIFR
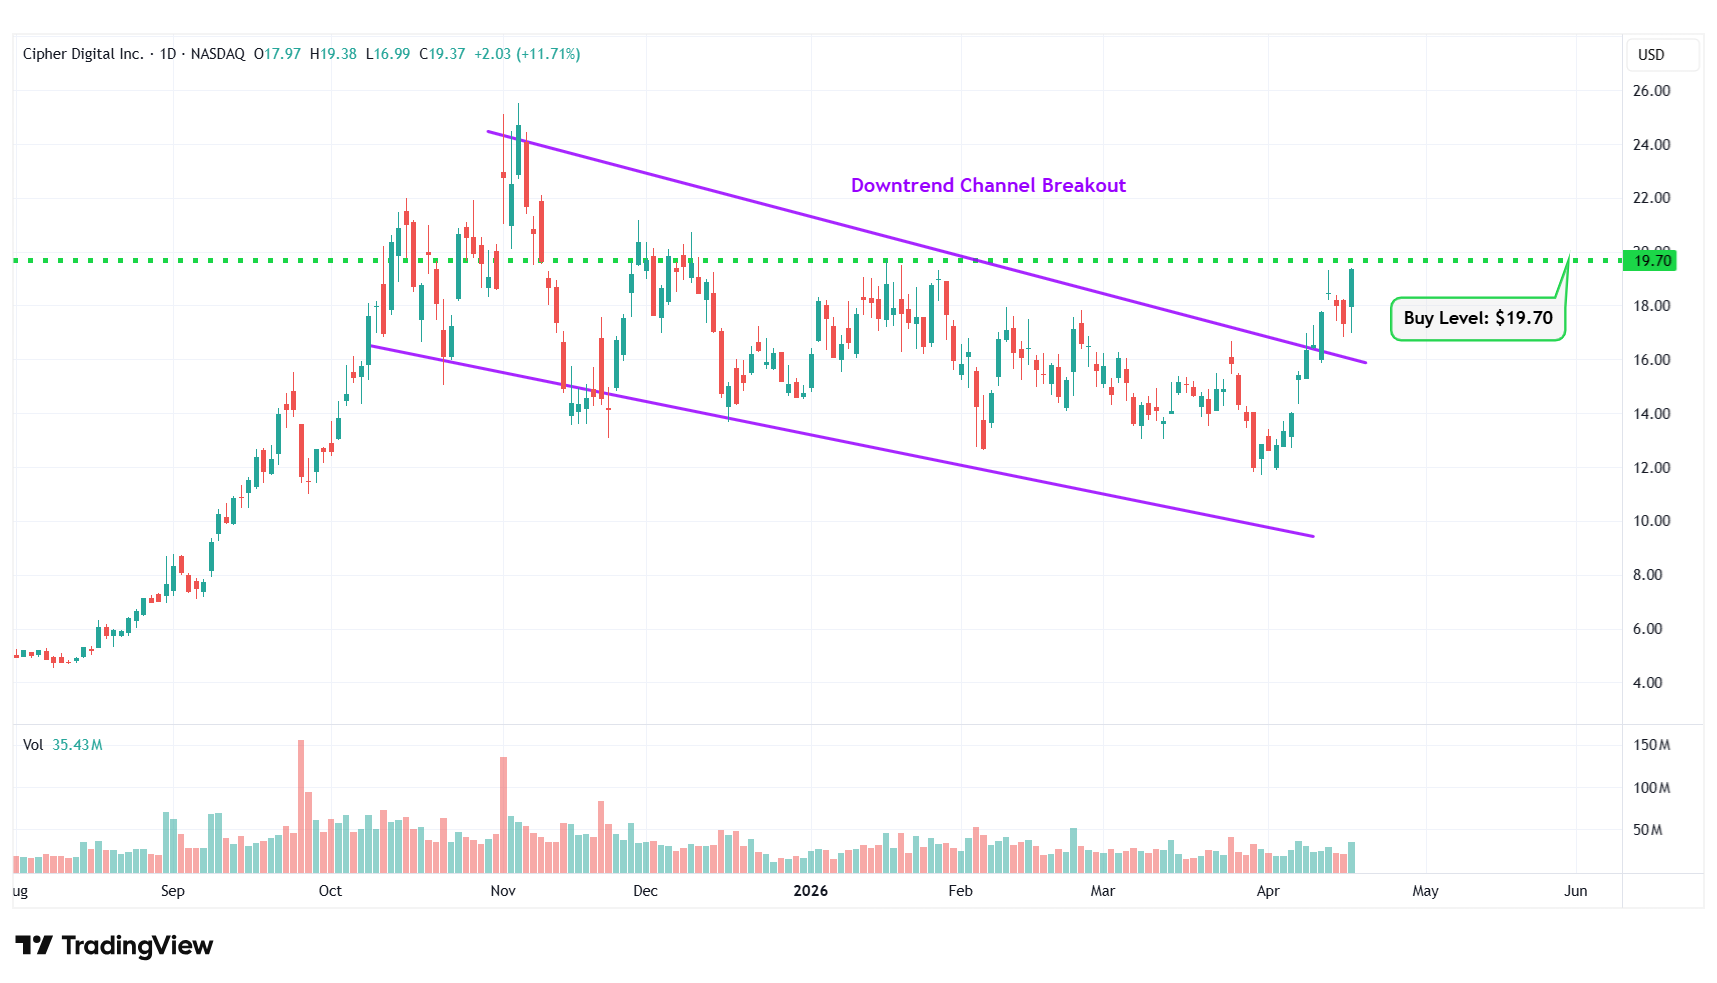
CIFR – Downtrend Channel Breakout
#7 Trevi Therapeutics Inc. (NASDAQ: TRVI)
Sector: Healthcare • Biotechnology
Reason: Breakout From a Consolidation Area in the Daily Chart
A Consolidation Area is a price action contained between two parallel lines. It is formed by a lower line that connects the lows, and an upper line that joins the highs. A stock usually trades between the two lines of the consolidation area before finally breaking out from the upper rail.
Buy Level(s): Although the stock has currently broken out of a consolidation area, the ideal buy level for TRVI is above the near-term resistance area, which translates to a price of around $15.40. This is marked in the chart below as a green color dotted line.
Daily chart – TRVI
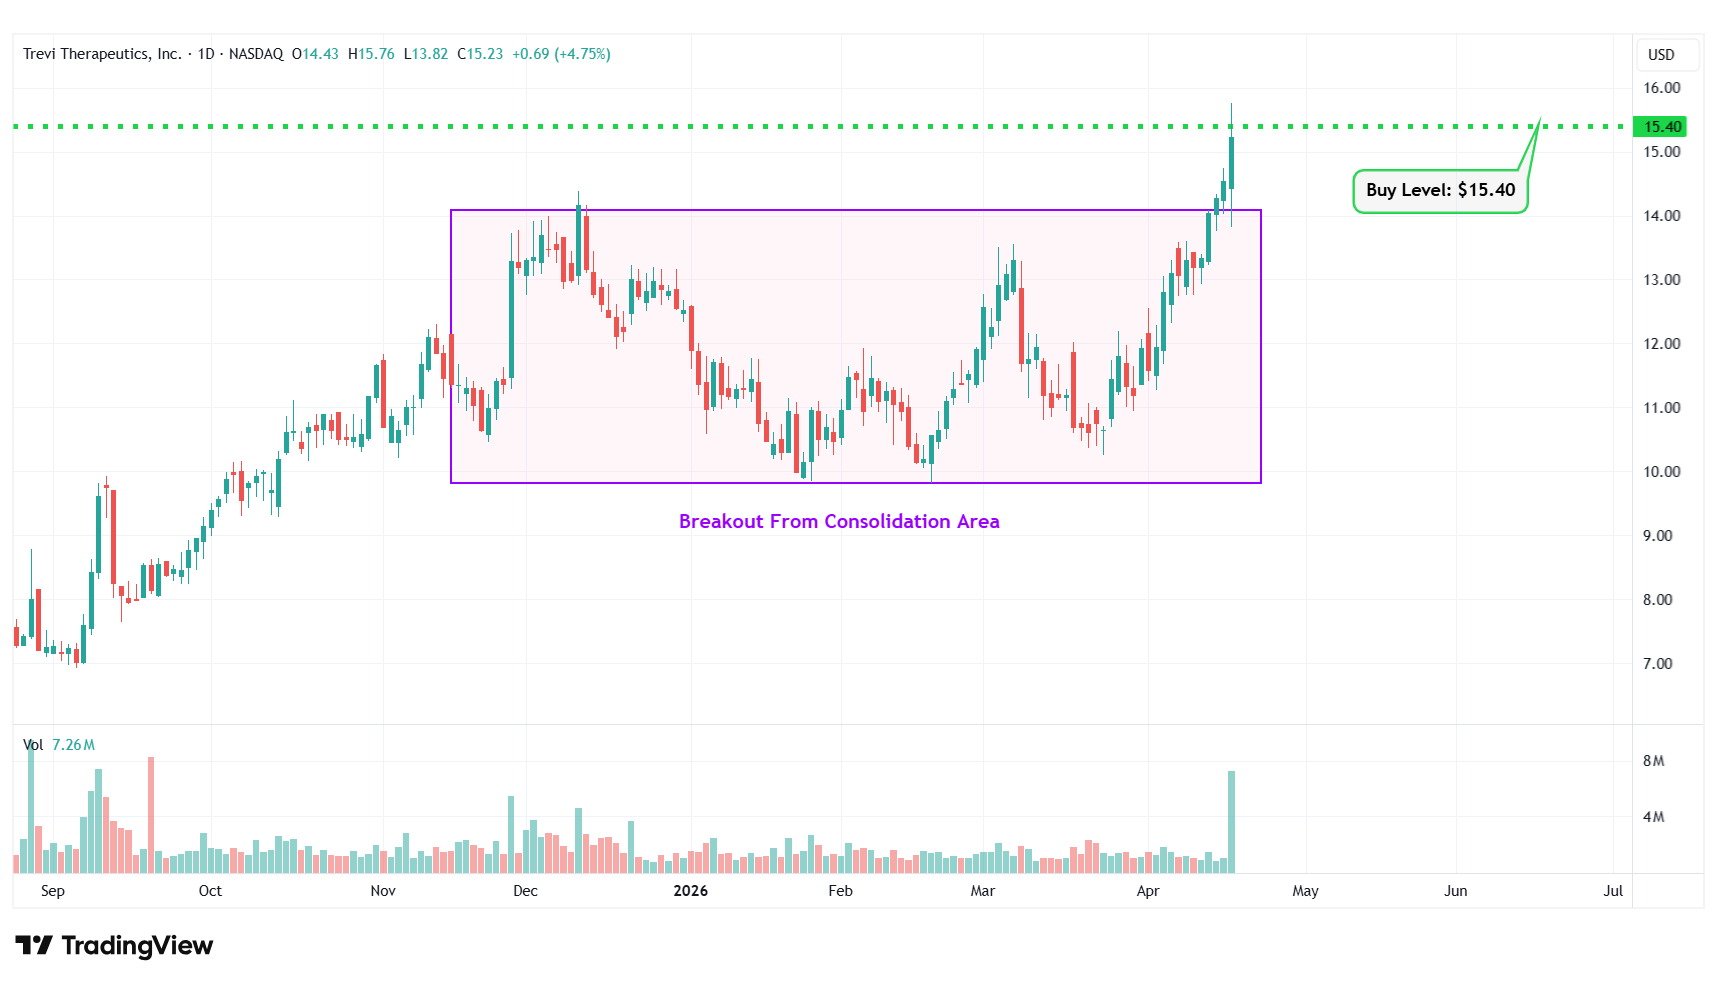
TRVI – Breakout From Consolidation Area
#8 Oklo Inc. (NYSE: OKLO)
Sector: Utilities • Utilities – Independent Power Producers
Reason: Falling Wedge Pattern Breakout
A falling wedge pattern is formed by joining two downward-sloping, converging trendlines having a contracting range. The pattern appears to be wide at the top and continues to contract as prices fall. A breakout from a falling wedge pattern can indicate either reversal or continuation, depending on where the pattern appeared in the trend.
A stock that has broken out of a falling wedge pattern would have gained momentum and would have the potential to move higher.
Buy Level(s): The stock has currently broken out of a falling wedge pattern. However, the ideal buy level for OKLO is above the nearest resistance level of $69.20. This is marked in the chart below as a green color dotted line.
Daily chart – OKLO
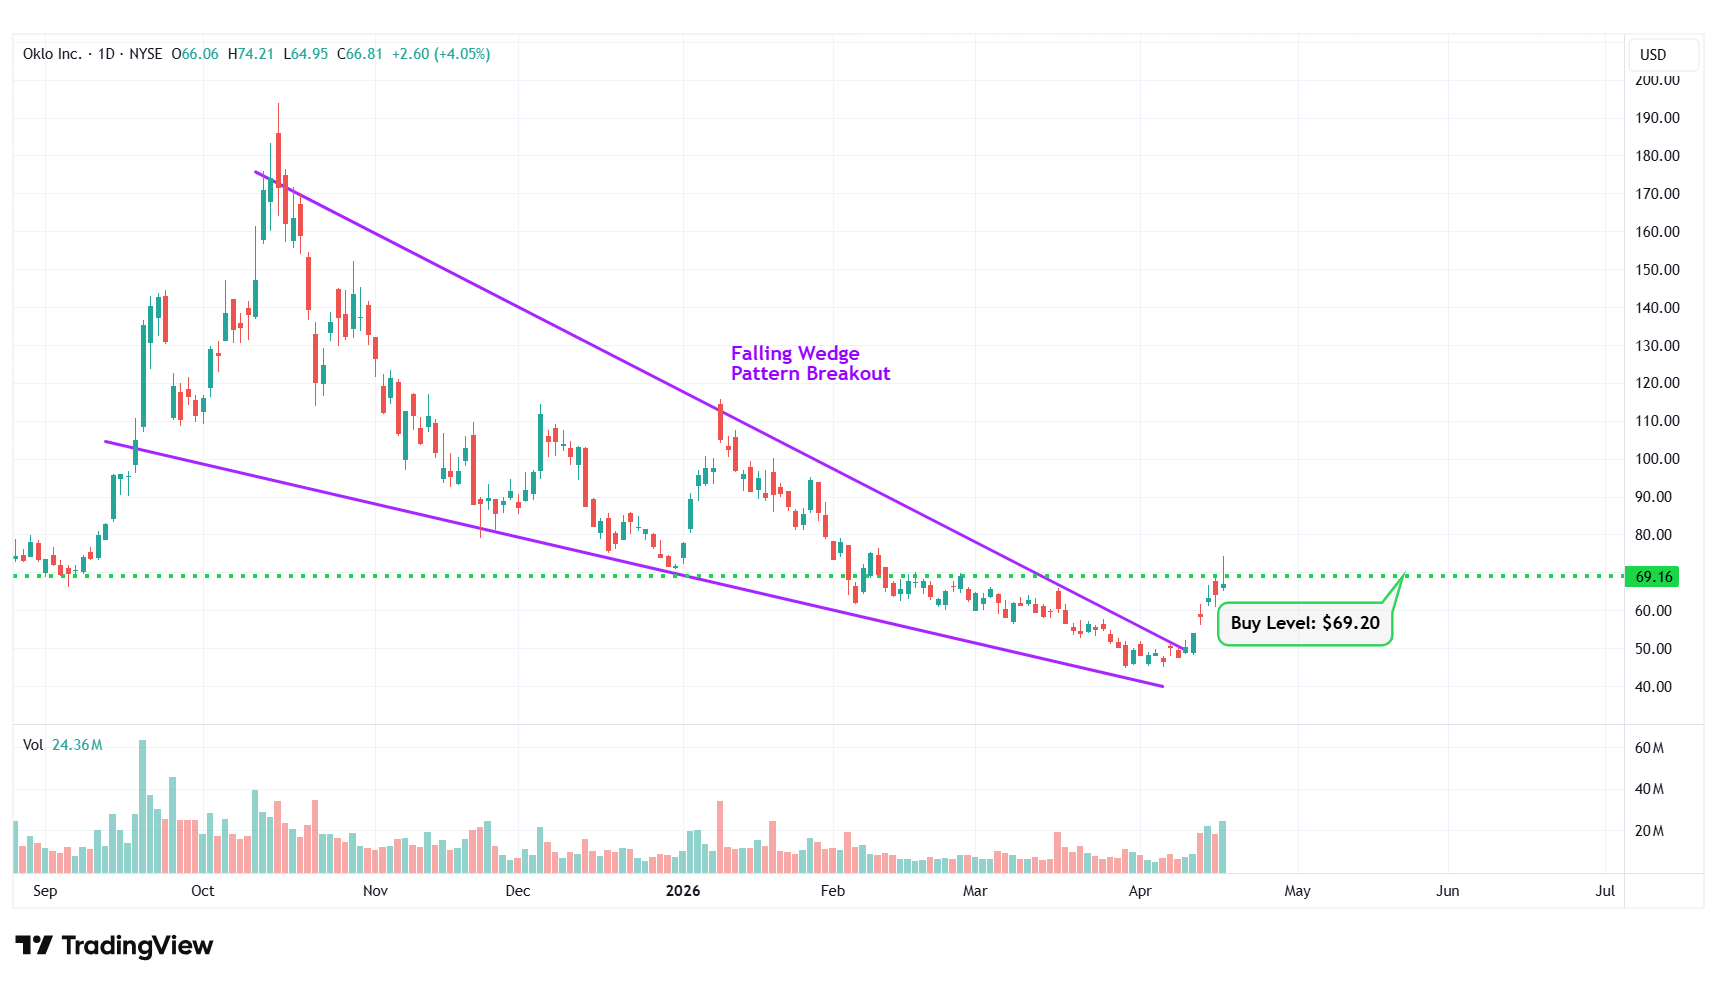
OKLO – Falling Wedge Pattern Breakout
#9 Alpha & Omega Semiconductor Ltd (NASDAQ: AOSL)
Sector: Technology • Semiconductors
Reason: Symmetrical Triangle Pattern Breakout
A symmetrical triangle is a chart pattern formed by two converging trend lines connecting a series of sequential peaks and troughs. These two lines result in the formation of a triangle that appears to be symmetrical.
A symmetrical triangle pattern is usually formed when there is indecision in the price movements and there is uncertainty among the buyers and sellers. This chart pattern represents a period of consolidation before the price breaks out or breaks down. In case a breakout occurs from the upper trend line, it is a strong bullish indication as it signifies the start of a new bullish trend.
Buy Level(s): The stock has currently broken out of a symmetrical triangle pattern. However, the ideal buy level for AOSL is if the stock closes above the immediate resistance level of $35.50. This is marked in the chart below as a green color dotted line.
Daily chart – AOSL
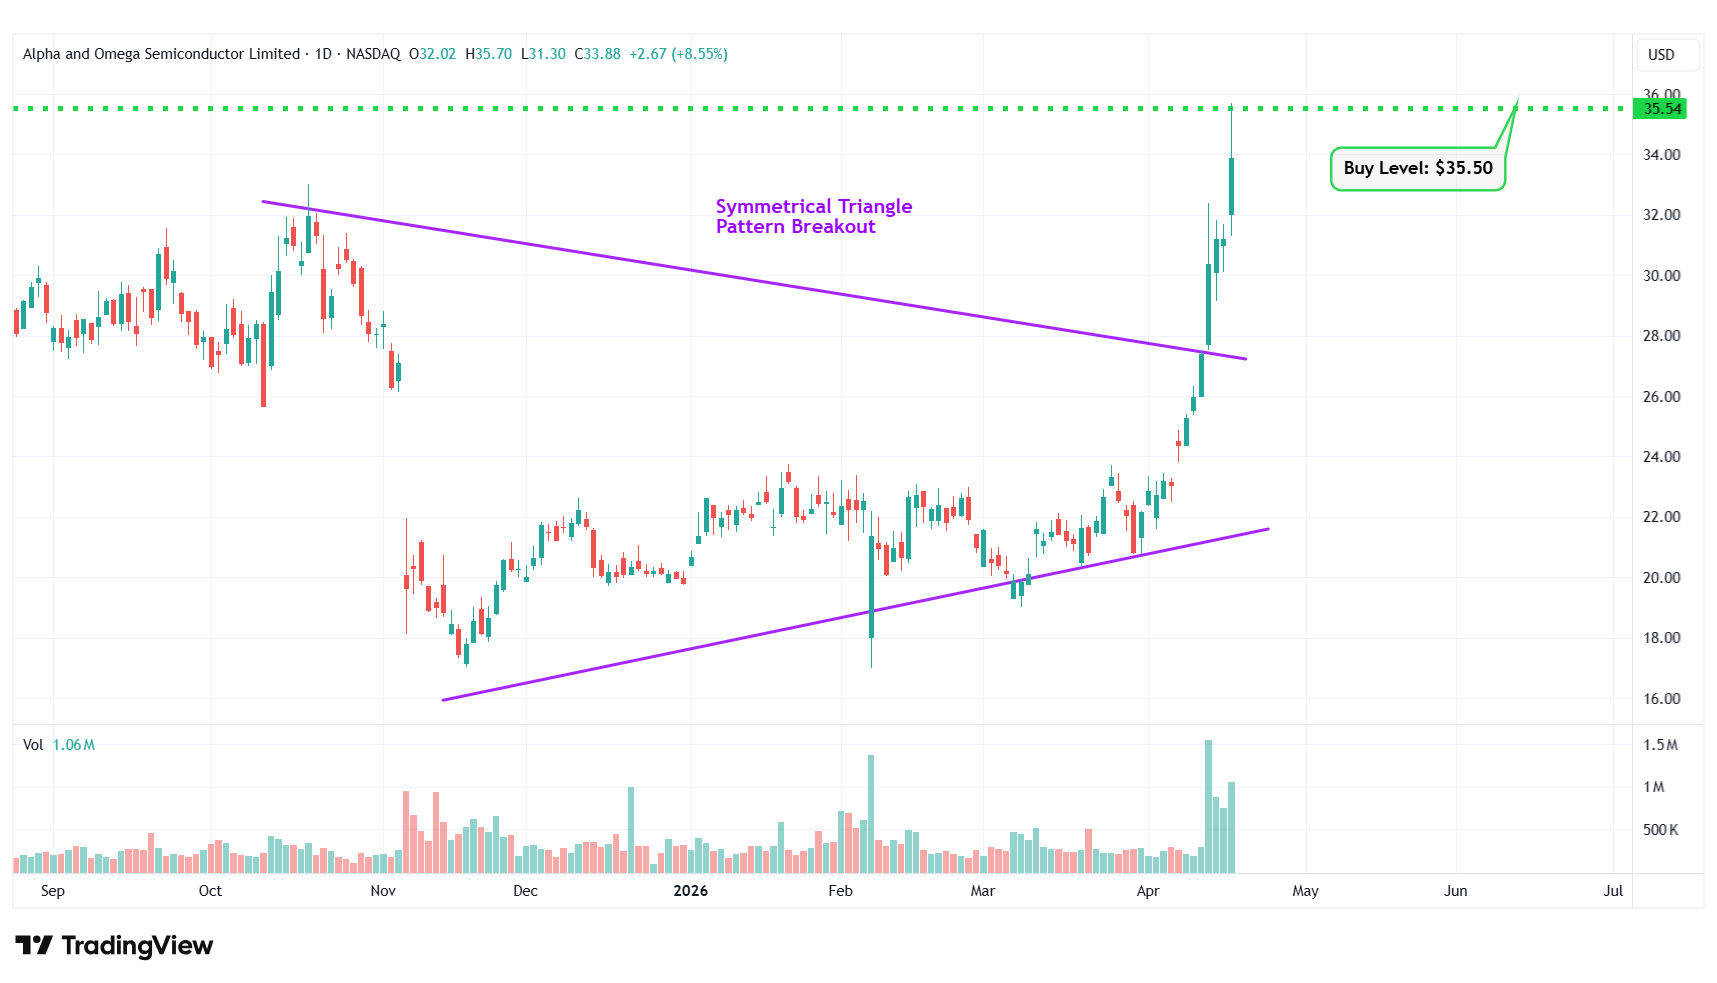
AOSL – Symmetrical Triangle Pattern Breakout
#10 Summit Therapeutics Inc. (NASDAQ: SMMT)
Sector: Healthcare • Biotechnology
Reason: Downtrend Channel Breakout
A downtrend or descending channel is the price action contained between downward sloping parallel lines. It is formed by two lines that are drawn by connecting the lower highs and lower lows of a stock’s price. Even though this is typically a bearish pattern, a breakout from the upper rail of this pattern is considered a good bullish indication.
Buy Level(s): The daily chart shows that the stock has currently broken out of a downtrend channel. However, there is a near-term resistance level for the stock. Hence, the ideal buy level for SMMT is if the stock has a daily close above $25.60. This is marked in the chart below as a green color dotted line.
Daily chart – SMMT
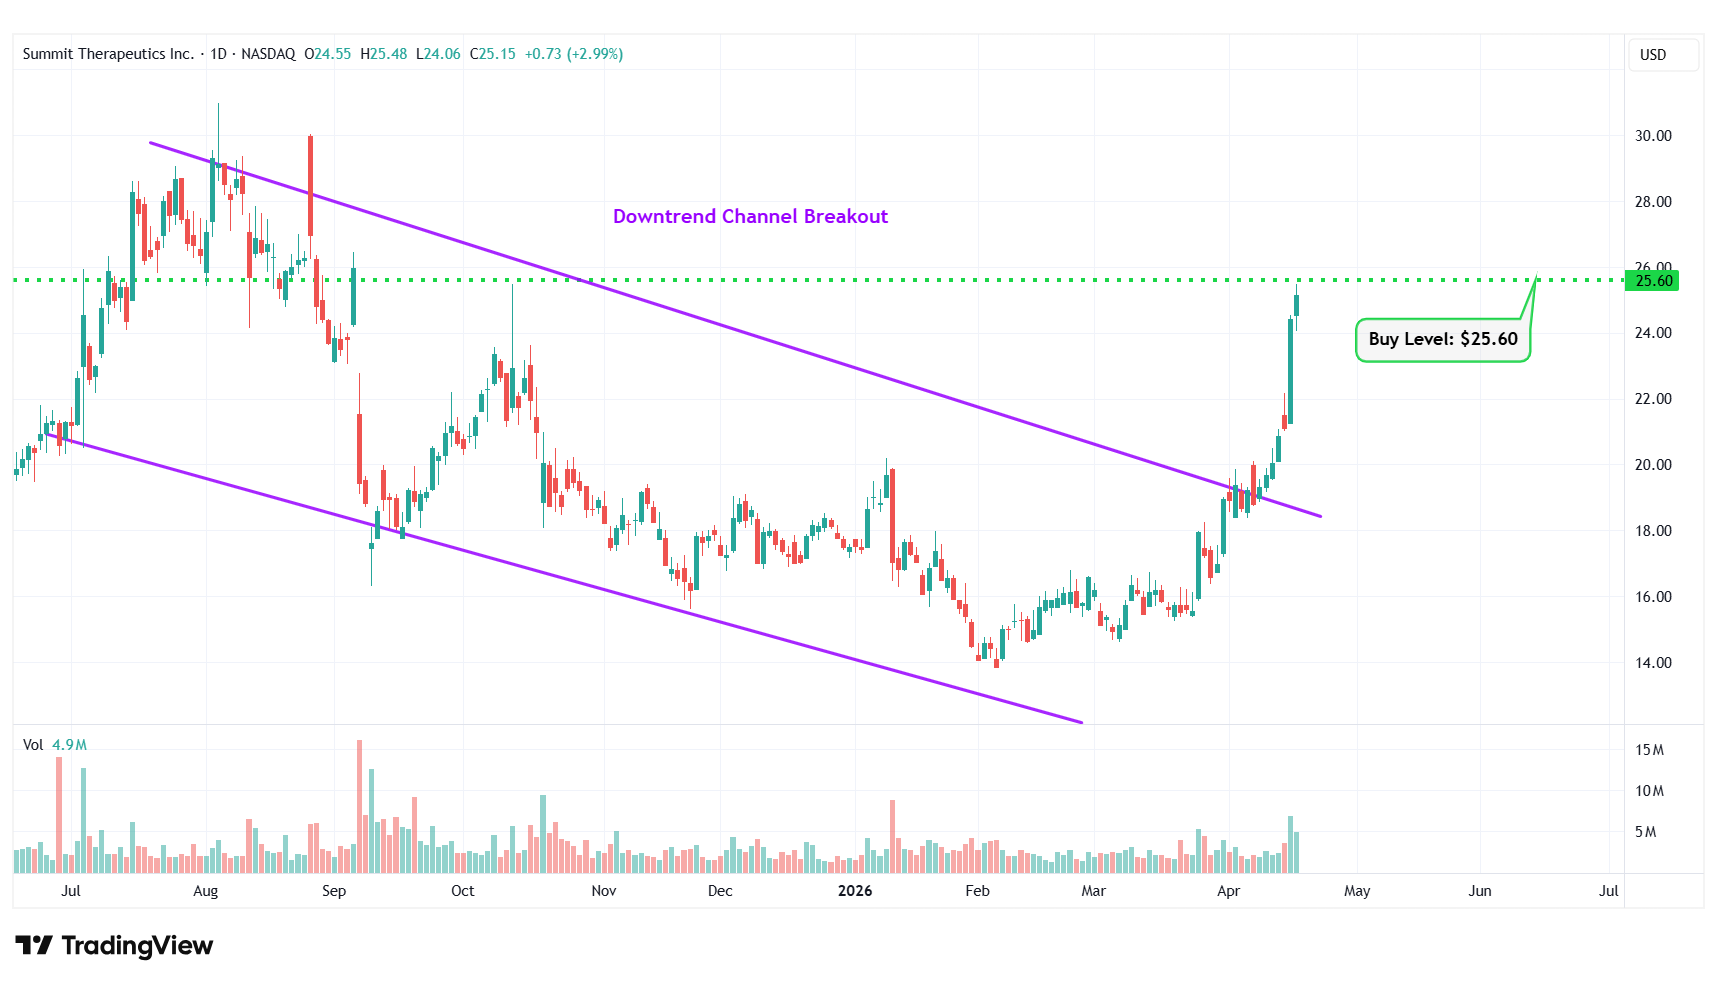
SMMT – Downtrend Channel Breakout
A choppy market tends to separate the real leaders from the names that were just along for the ride. This week, the setups that can hold their ground — and keep pressing higher — may end up being the most interesting ones on the board.
Happy Trading!
Tara and Greg
To carry out Trump's Executive Order #14196 initiative, the administration will have to partner with a handful of U.S. companies that control the "reserve accounts" sitting on trillions of dollars' worth of untapped natural resources. I've spent months digging into this – and I've identified three companies that have already been granted "emergency status" and fast-track approvals. I believe their shares could skyrocket once new capital starts moving into the sector. See the three stocks that I expect to be the biggest winners as this plan rolls.
Source: Trades of the Day
